Onventis Analytics 2024.5
Welcome to Onventis Analytics 2024.5! Prepare to elevate your procurement strategies with a plethora of exciting features in this latest release.
This release is all about charts! Discover the new chart type selector, dive into treemap charts, and explore scatter plots. Whatever your need, we’ve got a chart for it!
Exciting updates await—happy exploring! 🚀
New chart type selector
Treemap chart
Scatter plot
Category page
“Select all” in entity data tables and categorization
New in Analyze 📊
Chart type selector
Introducing our new chart type selector—making chart selection easier than ever! No more searching through toolbar icons; you’ll find it right next to the attributes you’ve selected for analysis. This convenient placement streamlines the process, allowing you to effortlessly analyze different attributes and choose the perfect chart for your needs.
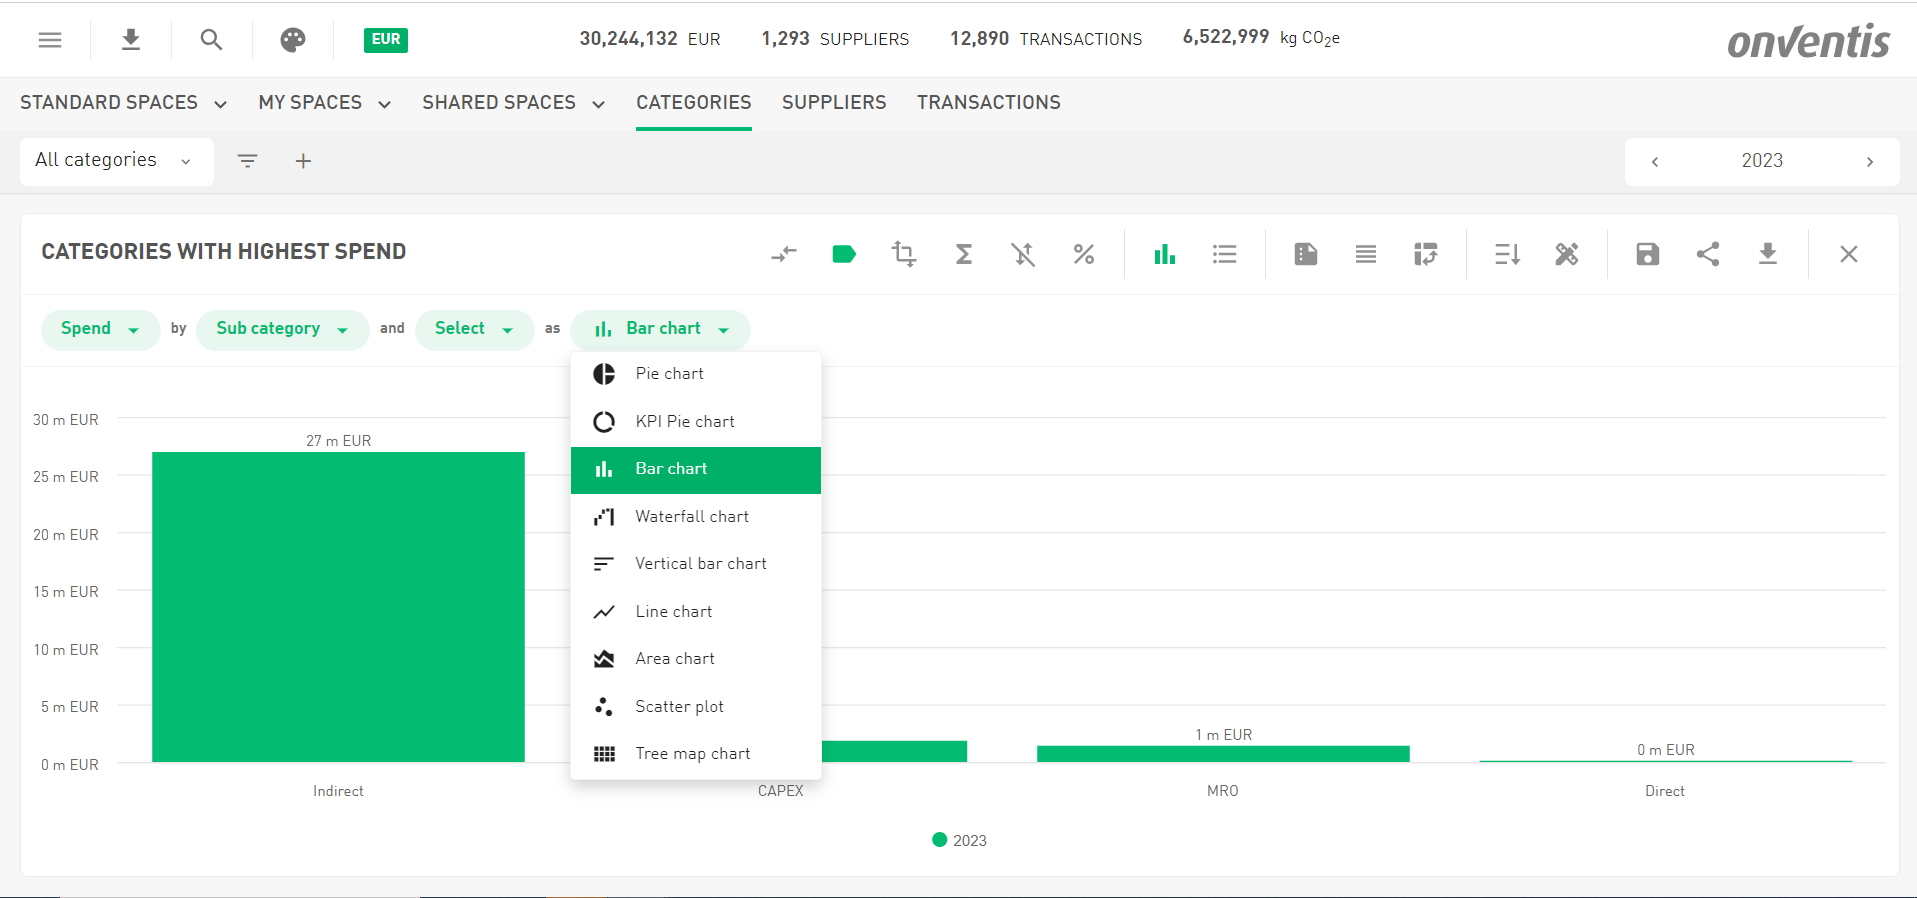
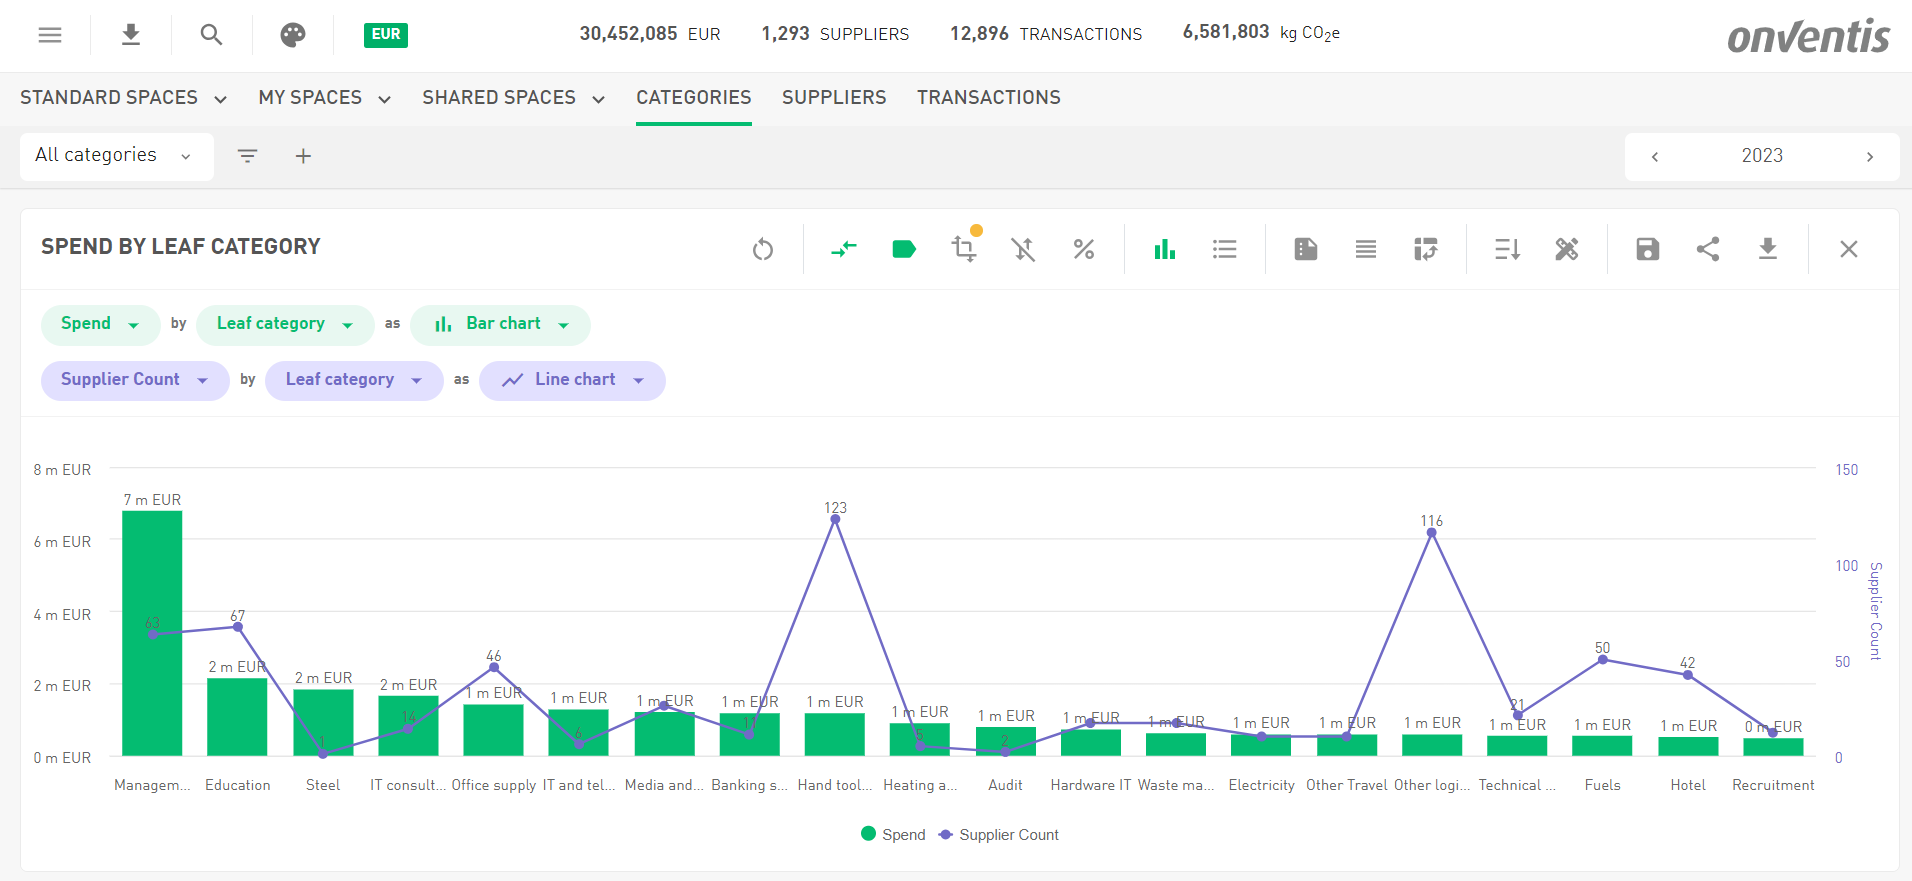
Chart type Combination
With our new chart type selector, combining charts for comparison is now a breeze. Simply select the metrics you want to compare and choose from the available charts in the chart type selector.
Treemap chart
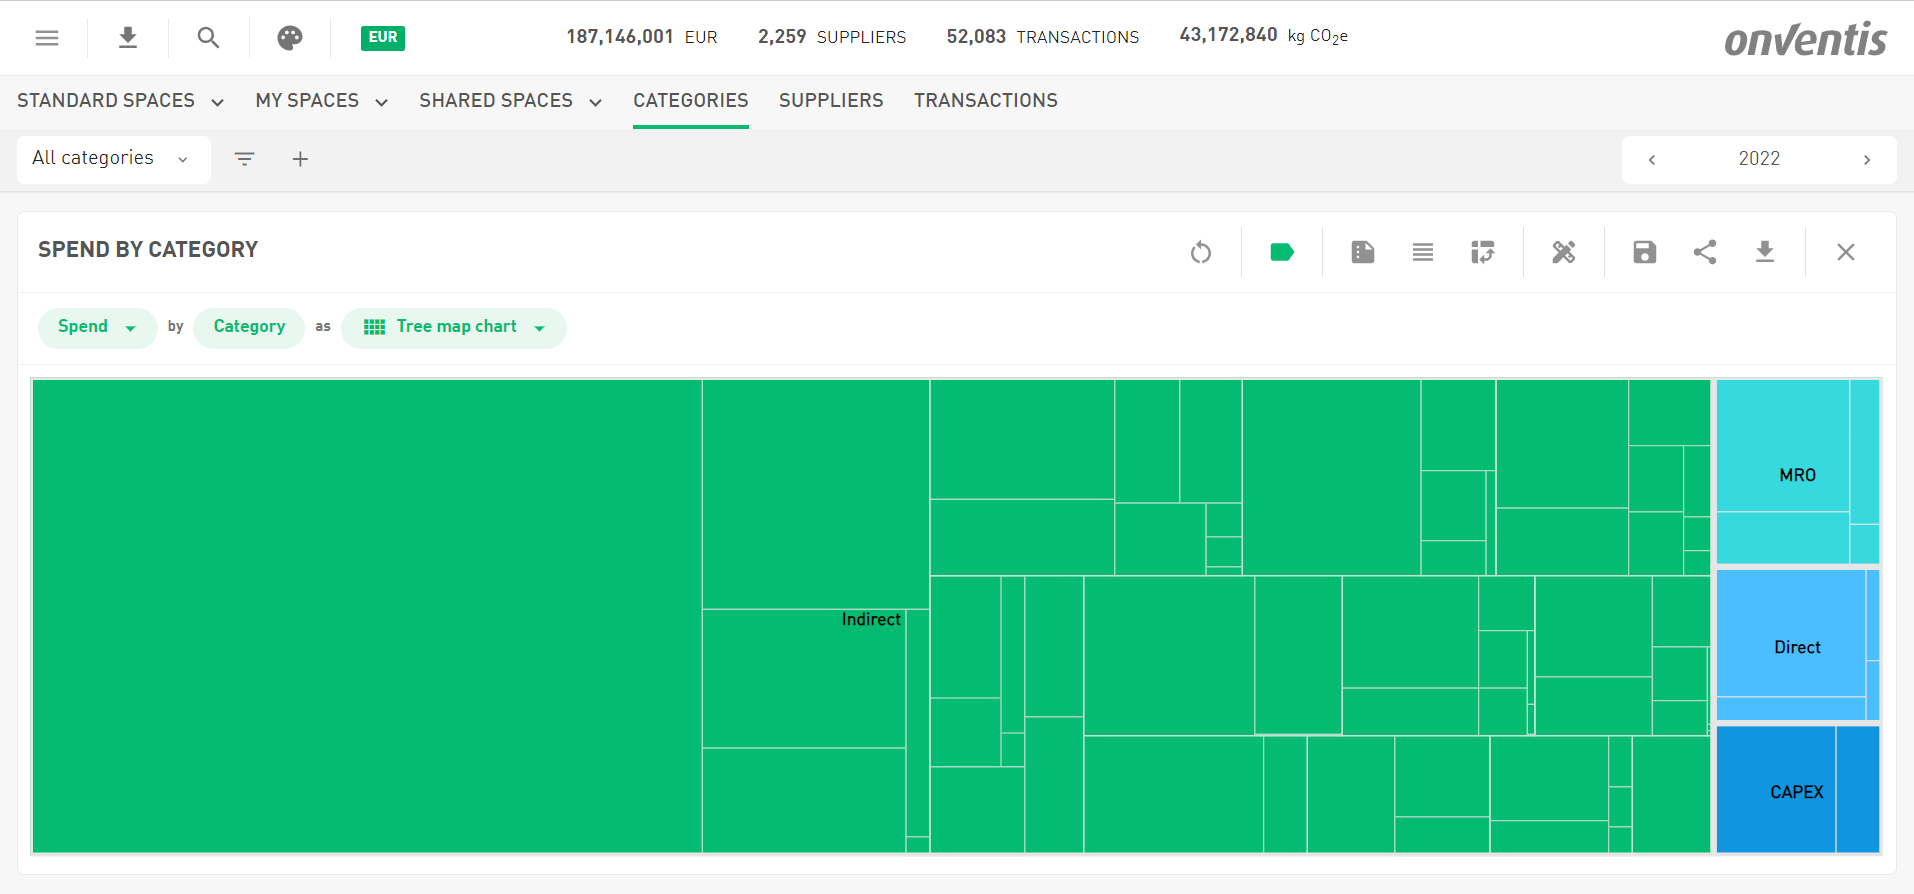
Introducing our new treemap chart! Perfect for analyzing categories and drilling down your category tree, this powerful visual tool helps you uncover hidden insights with ease.
A treemap chart displays hierarchical data as nested rectangles, with each branch represented by a colored area. This allows you to see proportions at a glance, making it ideal for breaking down complex data, spotting trends, and identifying key areas.
Just click in one area e.g. “Indirect” and drill down your category tree. Use it to visualize your spend by category, compare different categories, and make informed decisions quickly. Dive into your data like never before with the treemap chart.
Scatter Plot
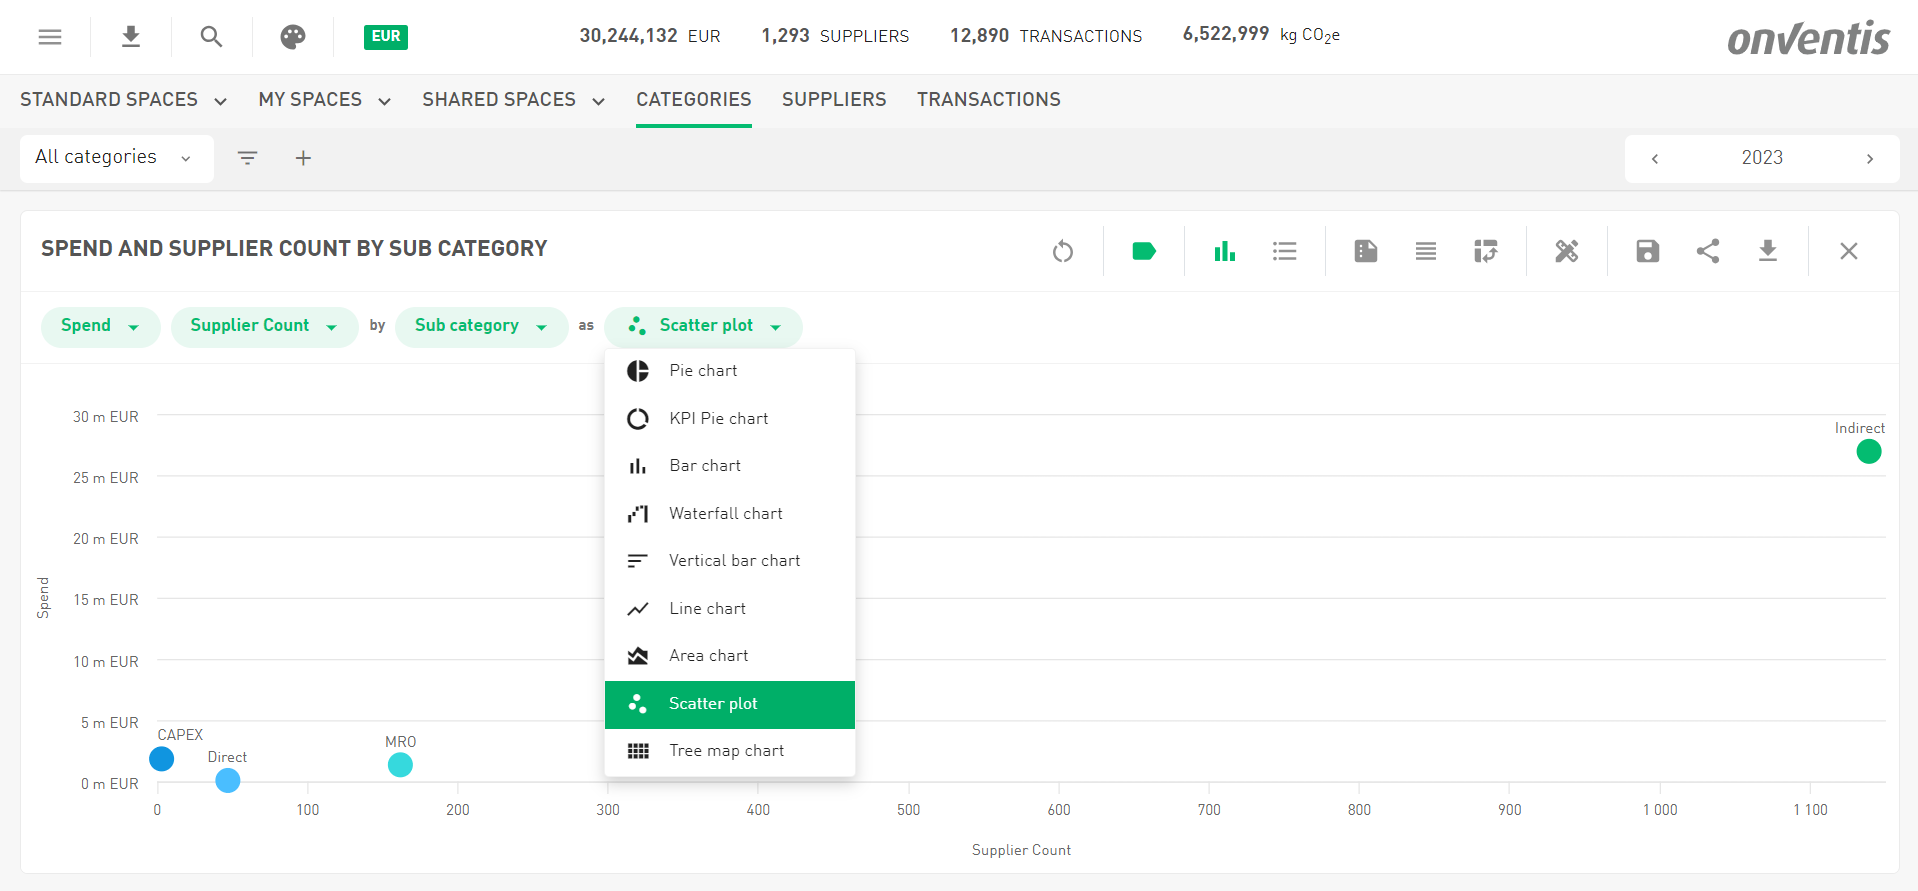
Discover our newly improved scatter plot, now effortlessly accessible and a vital addition to our chart selector!
A scatter plot lets you see how two variables are related by showing data points on a graph. This chart is perfect for identifying correlations, spotting outliers, and understanding data distribution.
Use the scatter plot to uncover trends, compare variables, and make data-driven decisions with confidence. Dive into deeper insights and visualize your data like never before with our improved scatter plot!
New in Categorization 💸
Category Card: All your Category Info in One Place
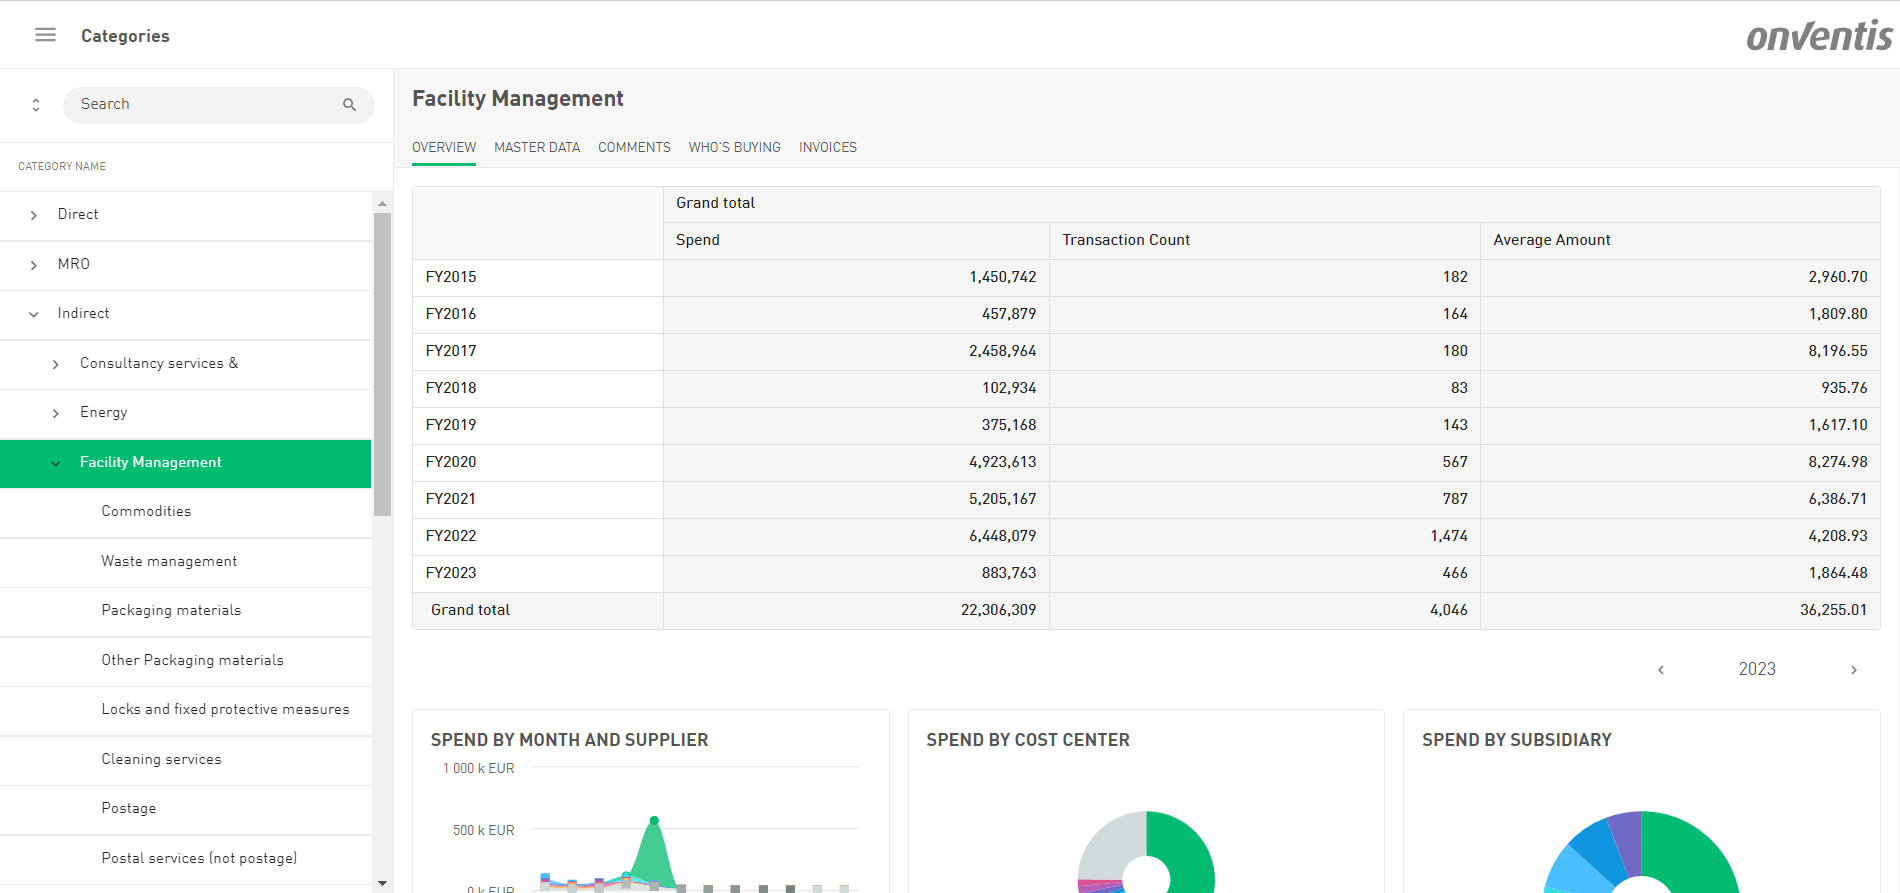
We love our Supplier card as much as you do, so we’ve decided to create a Category card too! This new feature is your go-to for accessing comprehensive category insights.
With this update, all category data is conveniently located in its one page, which you can either access via its own menu item or when analyzing a category.
No more switching between pages to gather information about a category—everything is now consolidated into one seamless experience, making it easier than ever to manage your category information.
Notice the refreshed overview page, now featuring spend over time for each category in a sleek pivot table format. We’ve applied the same clean and consistent structure to our beloved Supplier card, ensuring a smooth experience for managing your spend by a supplier over time.
Dive into our category card and streamline your category management today!
“Select all” in Entity Data Tables and Categorization
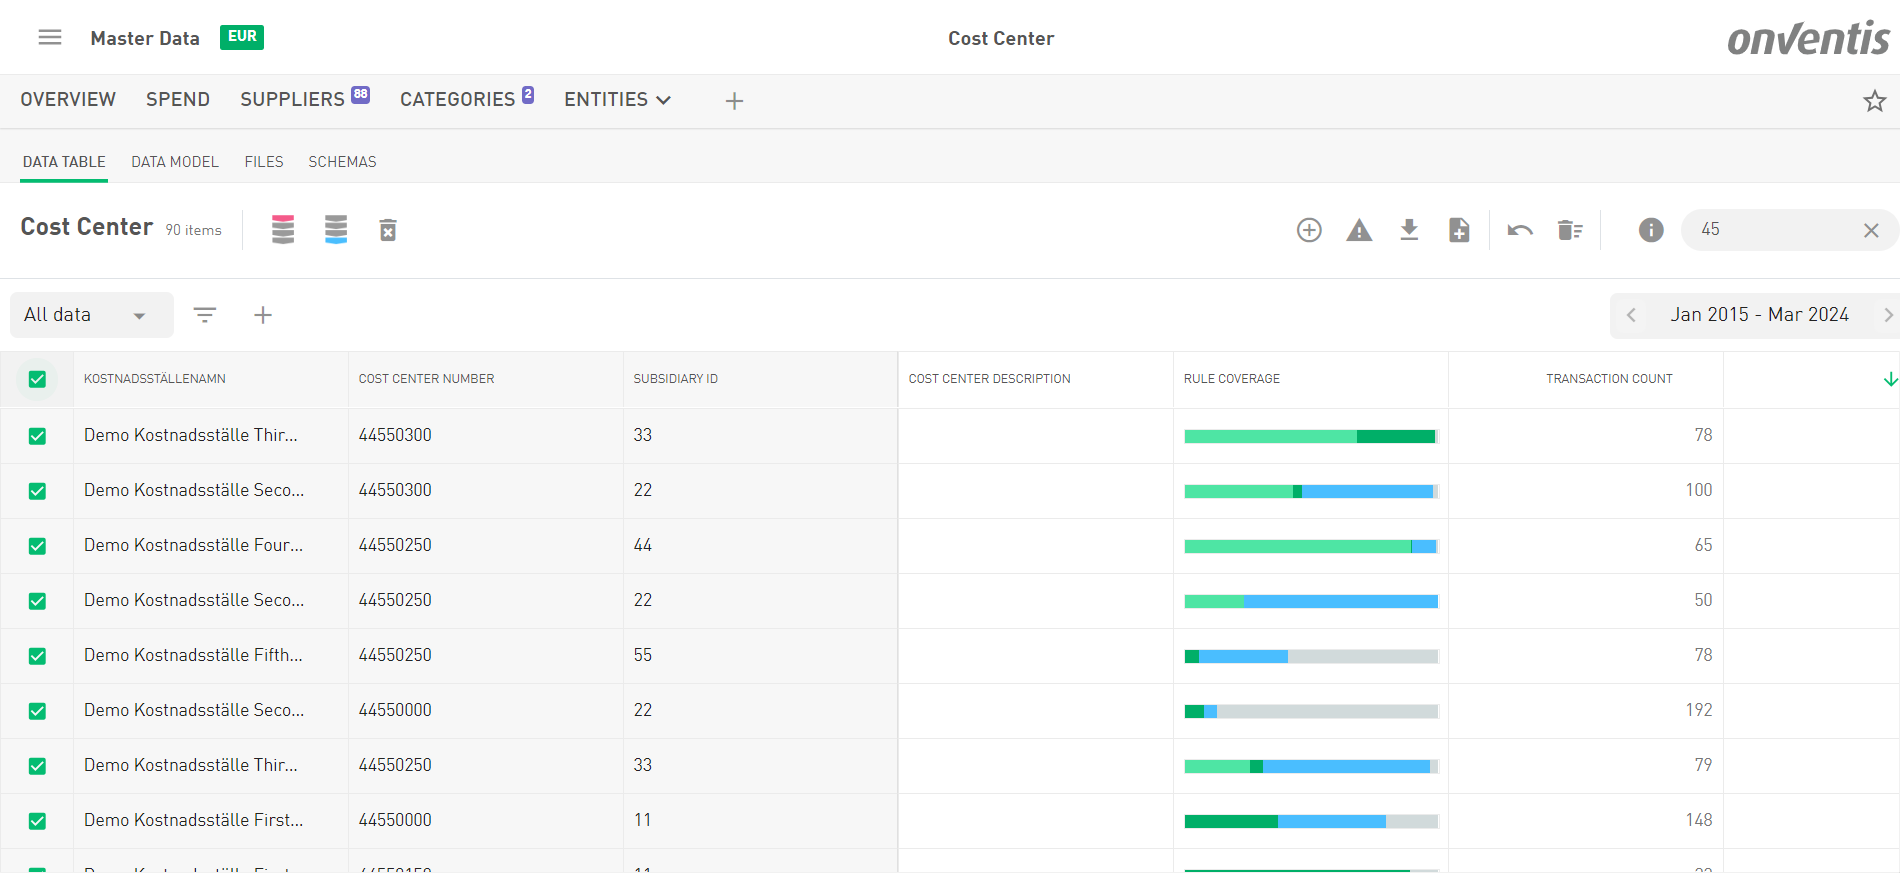
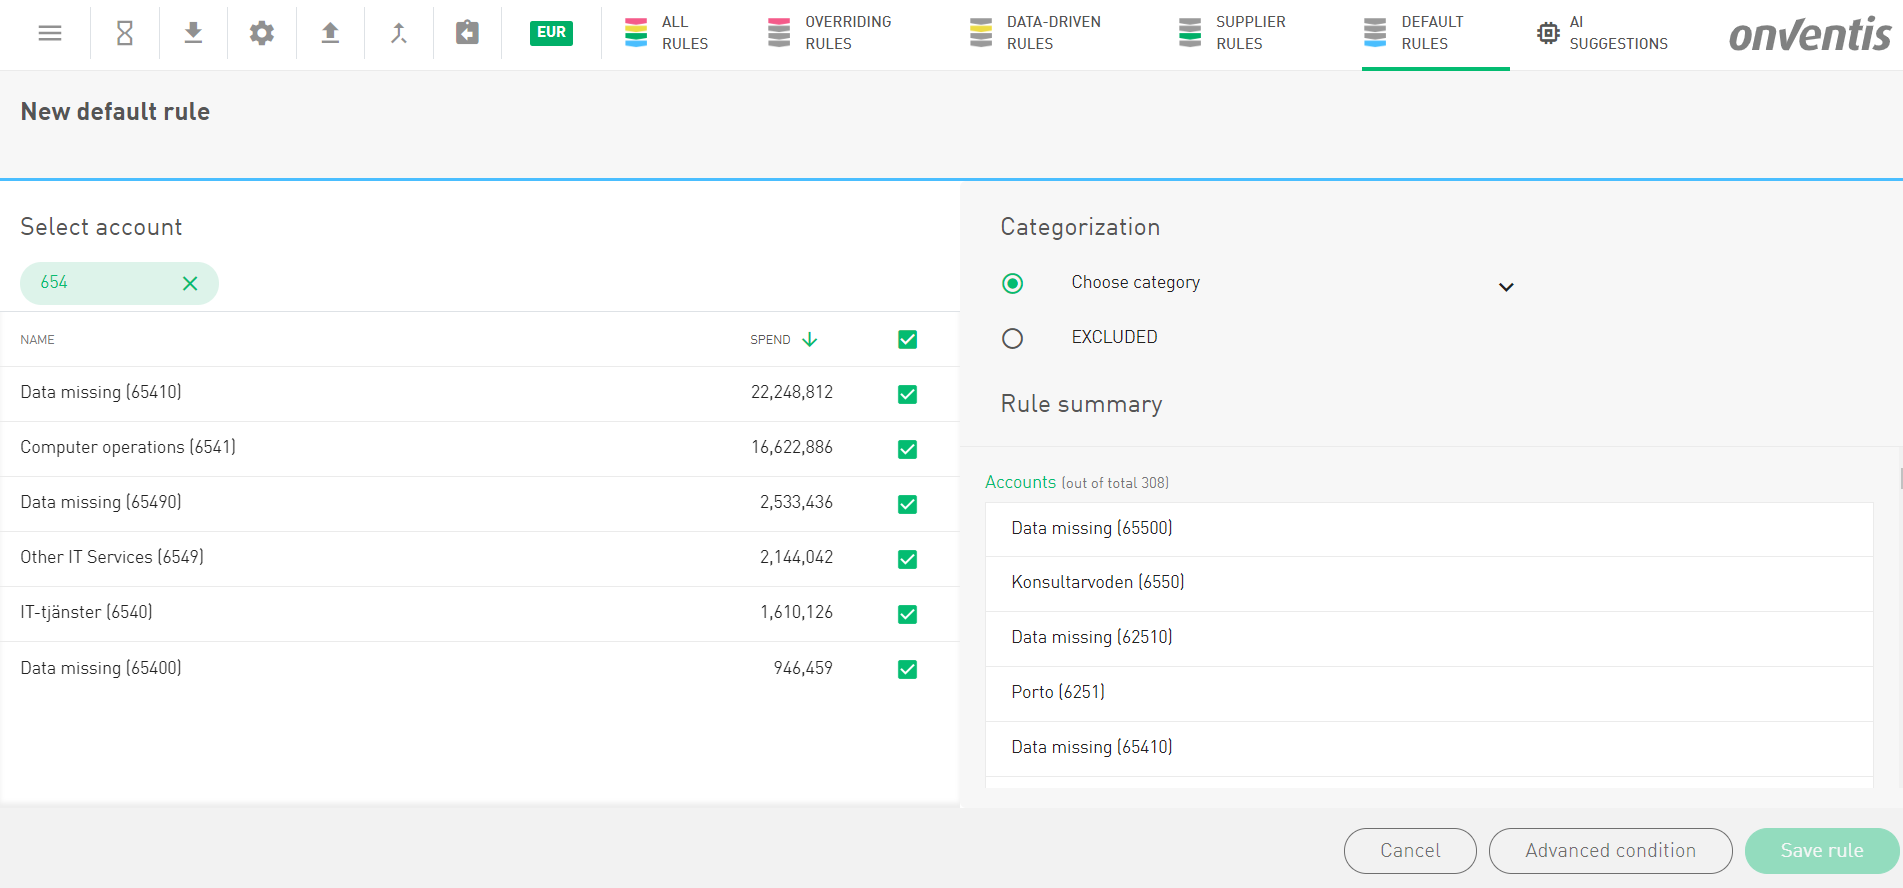
Now, you can easily select all available options in an entity data table, making it a breeze to select all available options. This is especially handy e.g. when you’re searching for cost centers starting with a certain number. You will also find this option when setting up rules to categorize your spend.
Please note, this feature maxes out at 1000 options at a time—because even our filters have limits!
