Onventis Analytics 2024.3
Welcome to Onventis Analytics 2024.3! This update brings exciting upgrades aimed at revolutionizing your data analysis experience.
Firstly, comparisons are now easier than ever. Our latest enhancement allows effortless comparison of different values within dimensions, enabling deeper insights for internal benchmarking, supplier relationship optimization, and decision-making.
Additionally, you can now seamlessly toggle between stacked and grouped bar charts, providing flexibility in visualizing data layers or comparing categories. Plus sorting charts in ascending or descending orders is now a breeze, offering flexibility and new perspectives in analysis.
Discover enhanced features tailored for Onventis Buyer customers! Dive into detailed spend analysis by agreement, effortlessly gaining deeper insights. Plus, simplify access to widgets with the innovative "View Widgets" access right, empowering focused decision-making.
Exciting updates await—happy exploring! 🚀
Comparisons
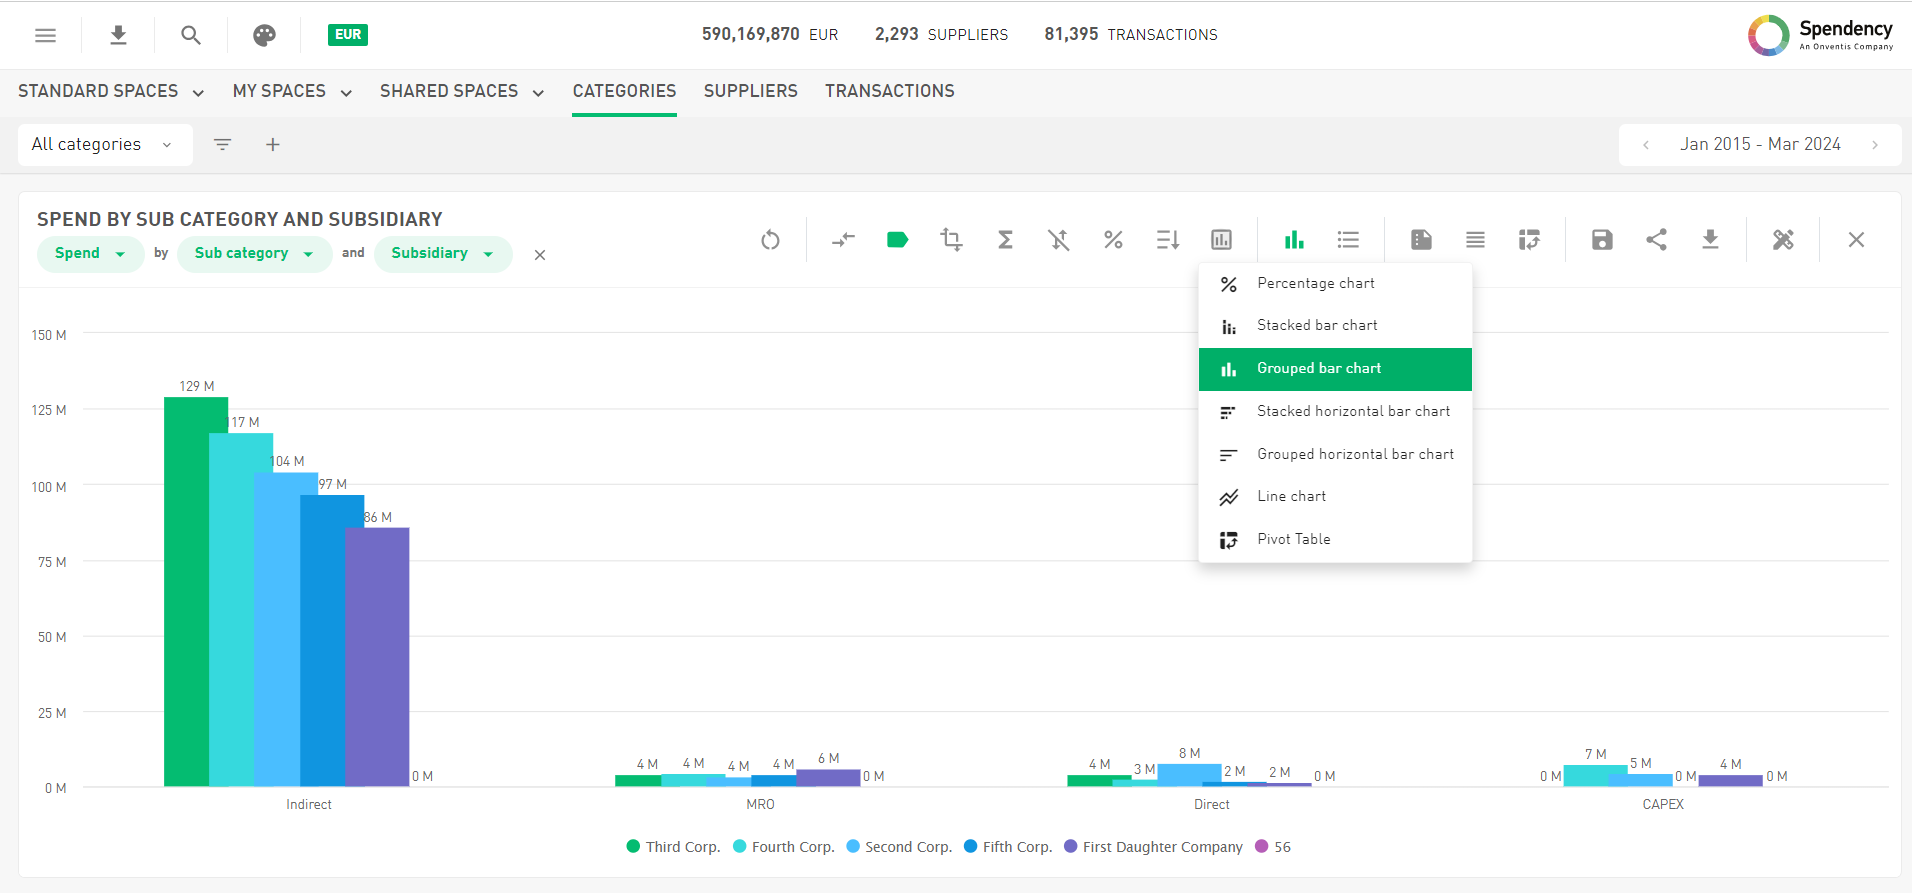
In addition to our existing time period comparison feature, we're thrilled to unveil a groundbreaking enhancement - the ability to compare split dimensions! But what exactly does this mean for you?
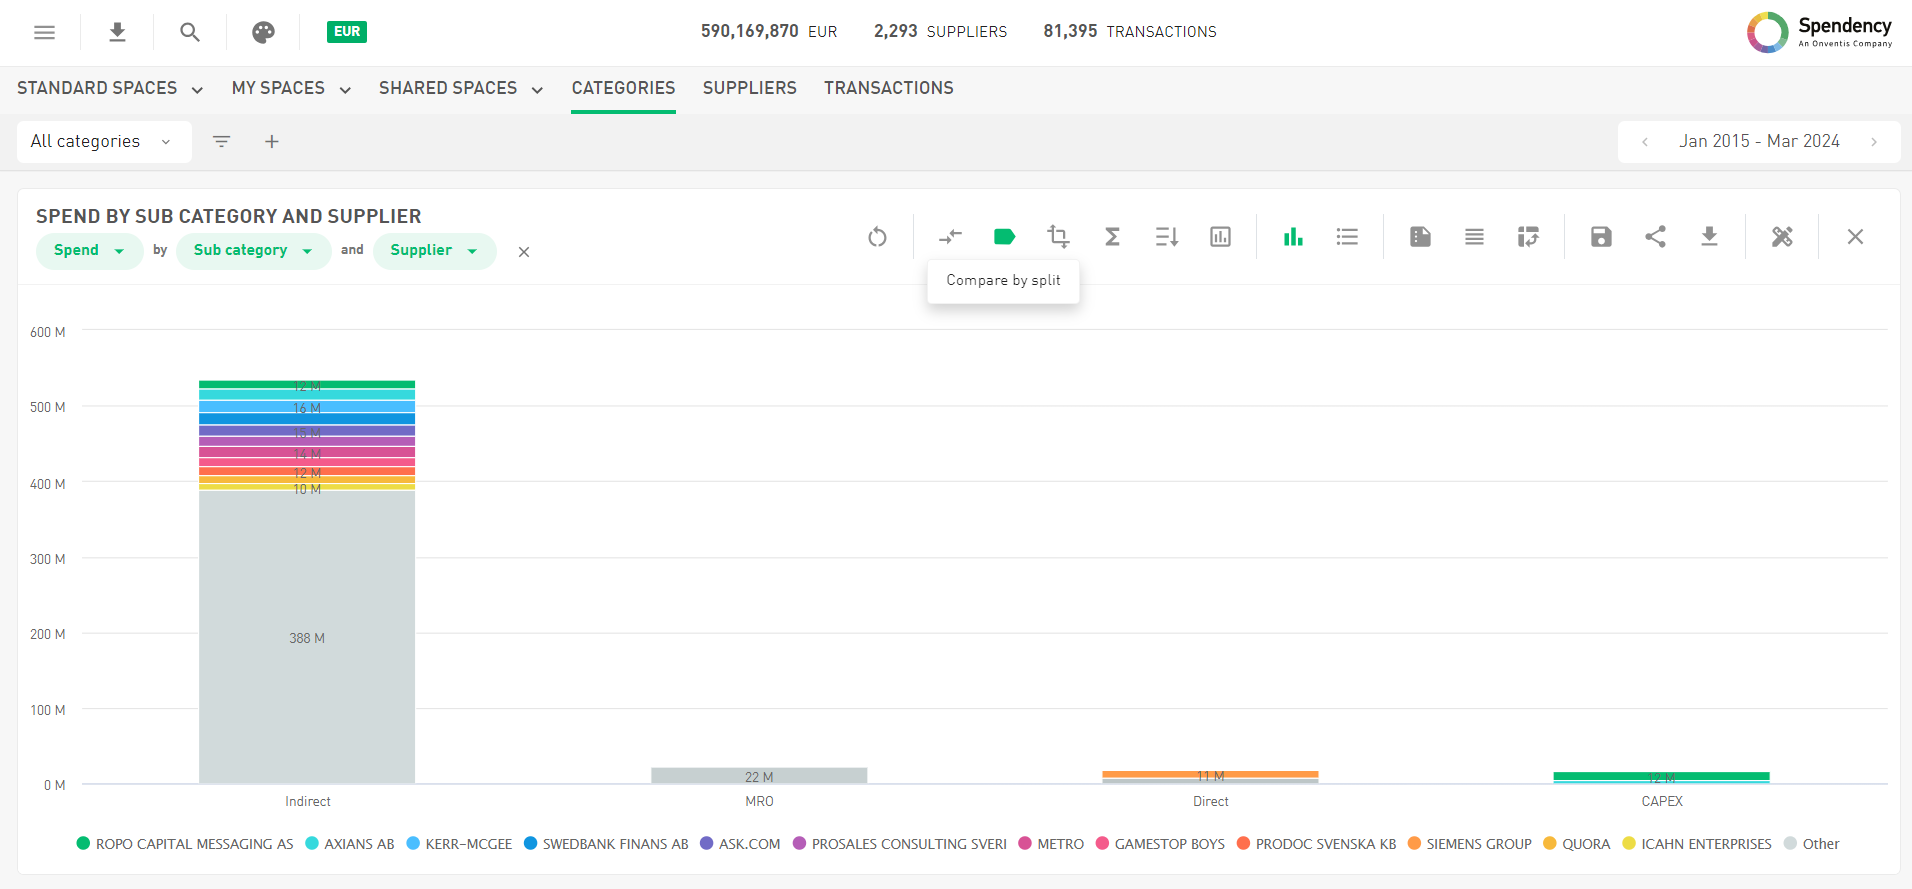
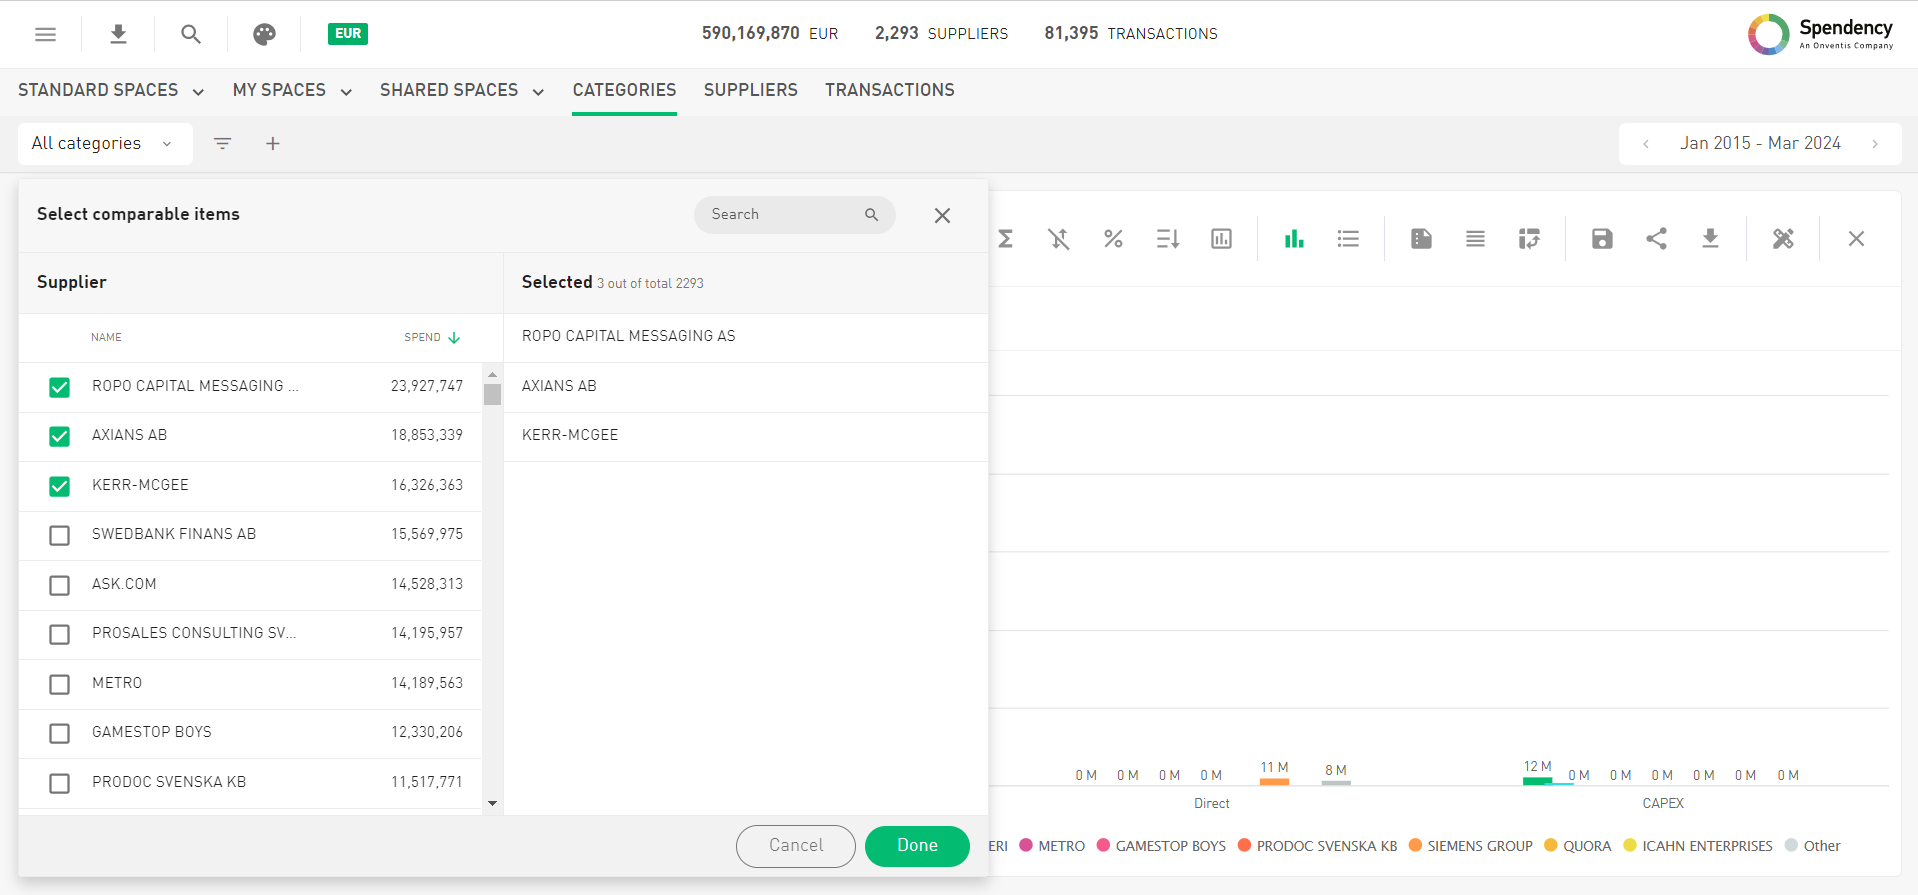
Imagine this: You've selected a split by dimension, say, suppliers, to view Spend by subcategory and supplier. Now, with our new comparison functionality, you can effortlessly assess how different values within that dimension stack up against each other. It's as simple as clicking on "compare split" to open the filter dialogue, where you can select up to 4 values for comparison.
But why is comparison relevant in Analytics? Let's explore the benefits:
Internal Benchmarking: By comparing split dimensions,you gain the invaluable ability to benchmark performance against internal standards such as across subsidiaries and cost centers. With internal benchmarking insights, you can establish realistic targets, monitor progress, and foster excellence within your organization's procurement and spend management processes.
Optimize Supplier Relationships: Comparing suppliers allows you to evaluate their performance side by side, enabling you to optimize relationships and drive better procurement strategies.
Enhance Decision Making: With the ability to compare split dimensions, you gain a deeper understanding of your data, empowering you to make data-driven decisions with confidence.
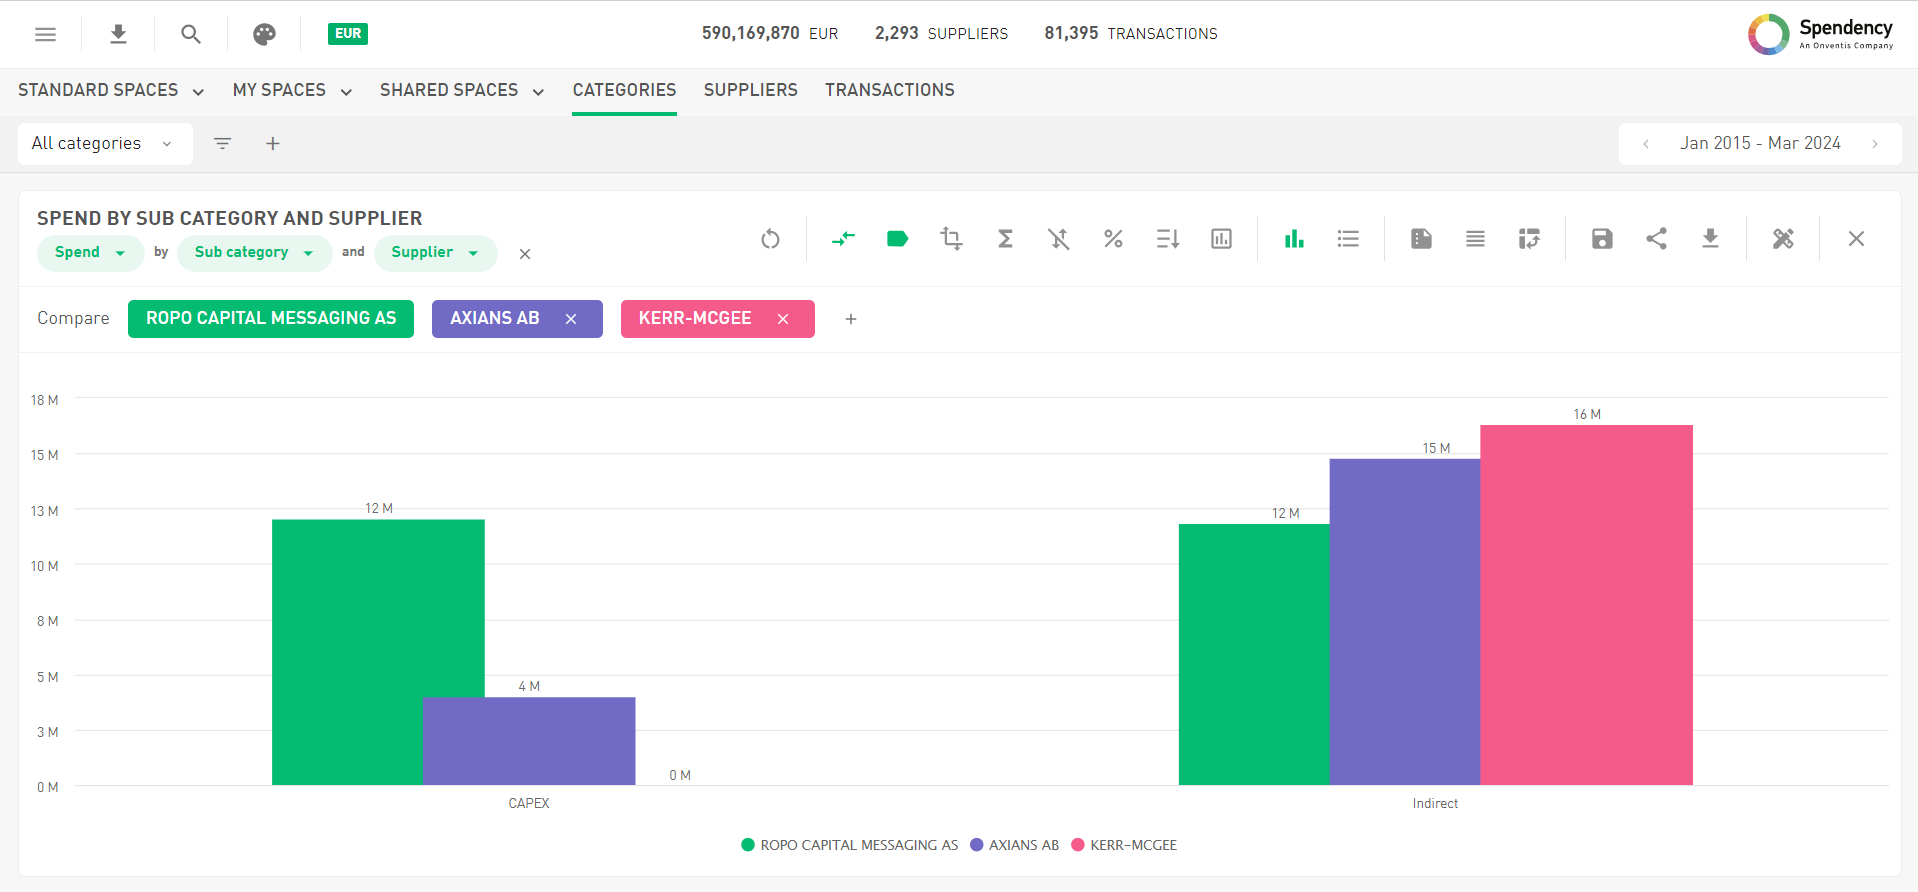
And the best part? While doing comparisons, the data is presented in grouped bar charts by default. Plus you still have the flexibility to easily change the graph type to suit your preferences, ensuring a personalized analytical experience tailored to your needs. For further insights on maximizing the potential of grouped bar charts, stay tuned for details in the next section!
Stacked and grouped bar chart
As previously mentioned, you now possess the ability to seamlessly toggle between stacked and grouped bar charts, in both horizontal and vertical orientations. Let's delve into the specifics:
Stacked Bar Charts: Think of your data as layers in a towering cake, each slice contributing to the overall flavor. Stacked charts neatly stack these layers, offering a comprehensive view of how each component contributes to the whole. Ideal for discerning trends and understanding relative proportions within your data.
Grouped Bar Charts: Imagine a banquet of data, with each category presented as its own distinct dish. Grouped charts maintain this separation, facilitating direct comparisons between categories. They're particularly useful when delving into split dimensions or conducting detailed analyses requiring side-by-side comparisons.
So, whether you're on a quest for comparative insights or embarking on a journey through spending distributions, remember: with great chart power comes great chart responsibility. Choose wisely, and may your data adventures be as entertaining as they are enlightening!
Supplier Comparison in Supplier Card
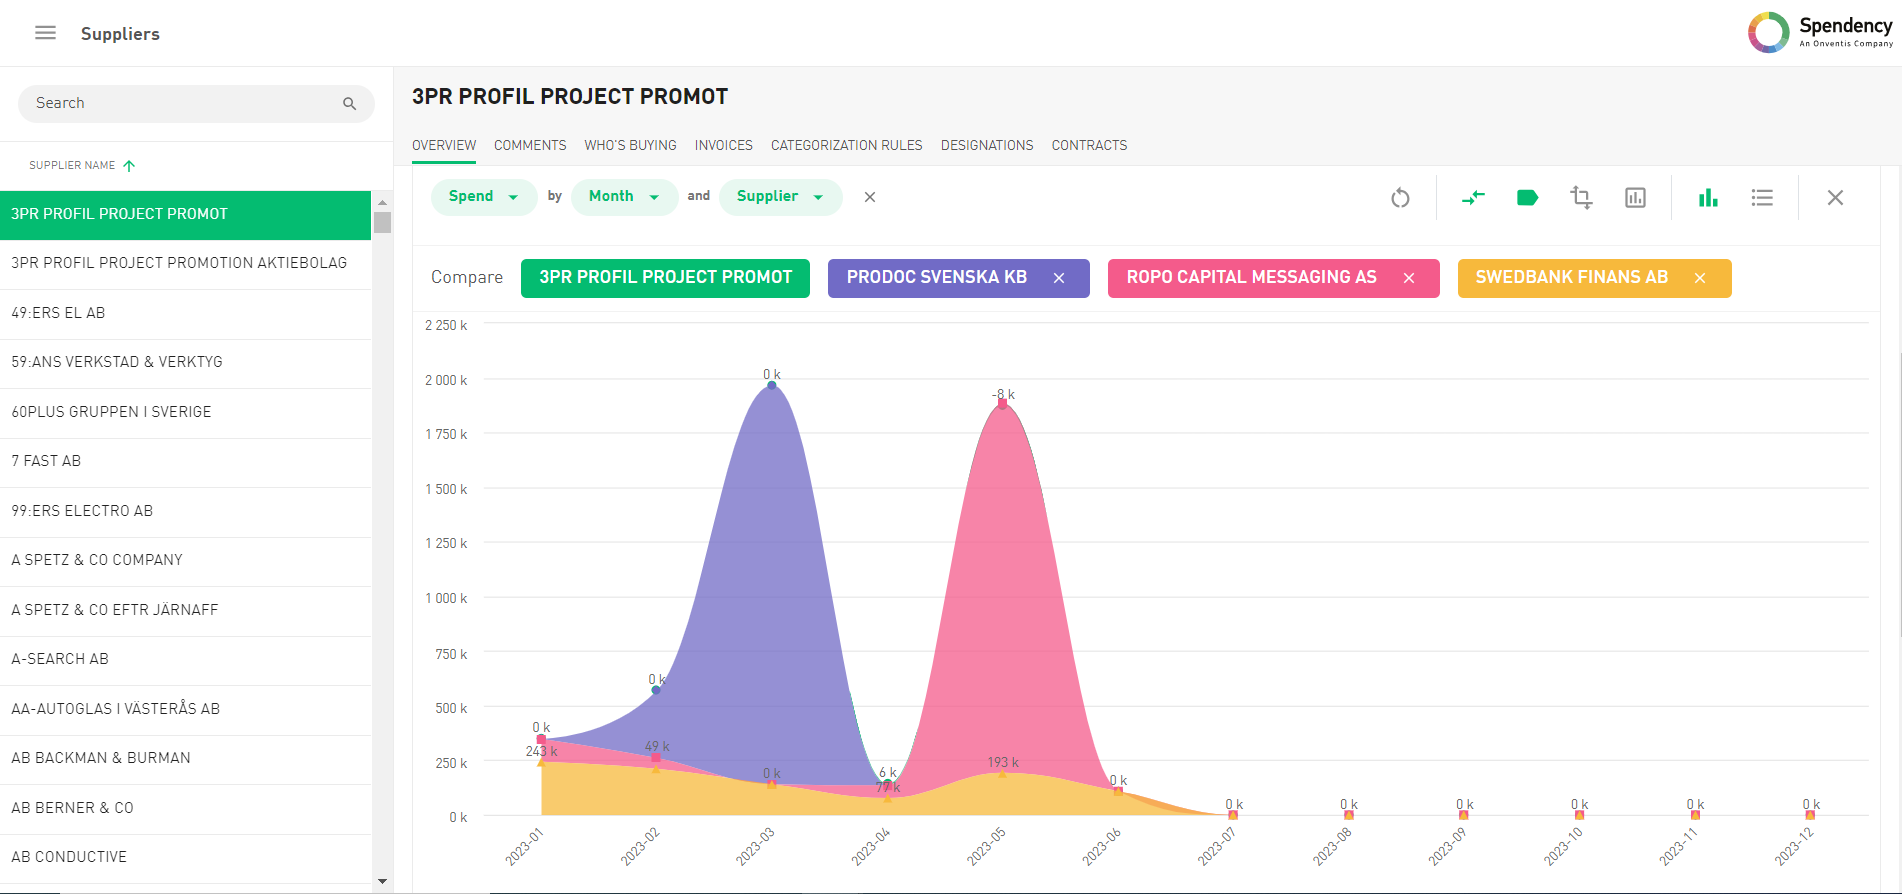
We've also introduced a groundbreaking feature that allows you to compare suppliers directly within the supplier card, revolutionizing the way you evaluate supplier performance. It's as simple as clicking on the "Compare with other suppliers" button and selecting up to three other suppliers you wish to compare.
Once selected, you'll be presented with a comprehensive chart showcasing spend by month and suppliers, all conveniently displayed within the supplier card itself. Say goodbye to the hassle of switching between pages to access this vital information - it's now readily available at your fingertips!
Sort Data ascending/ descending
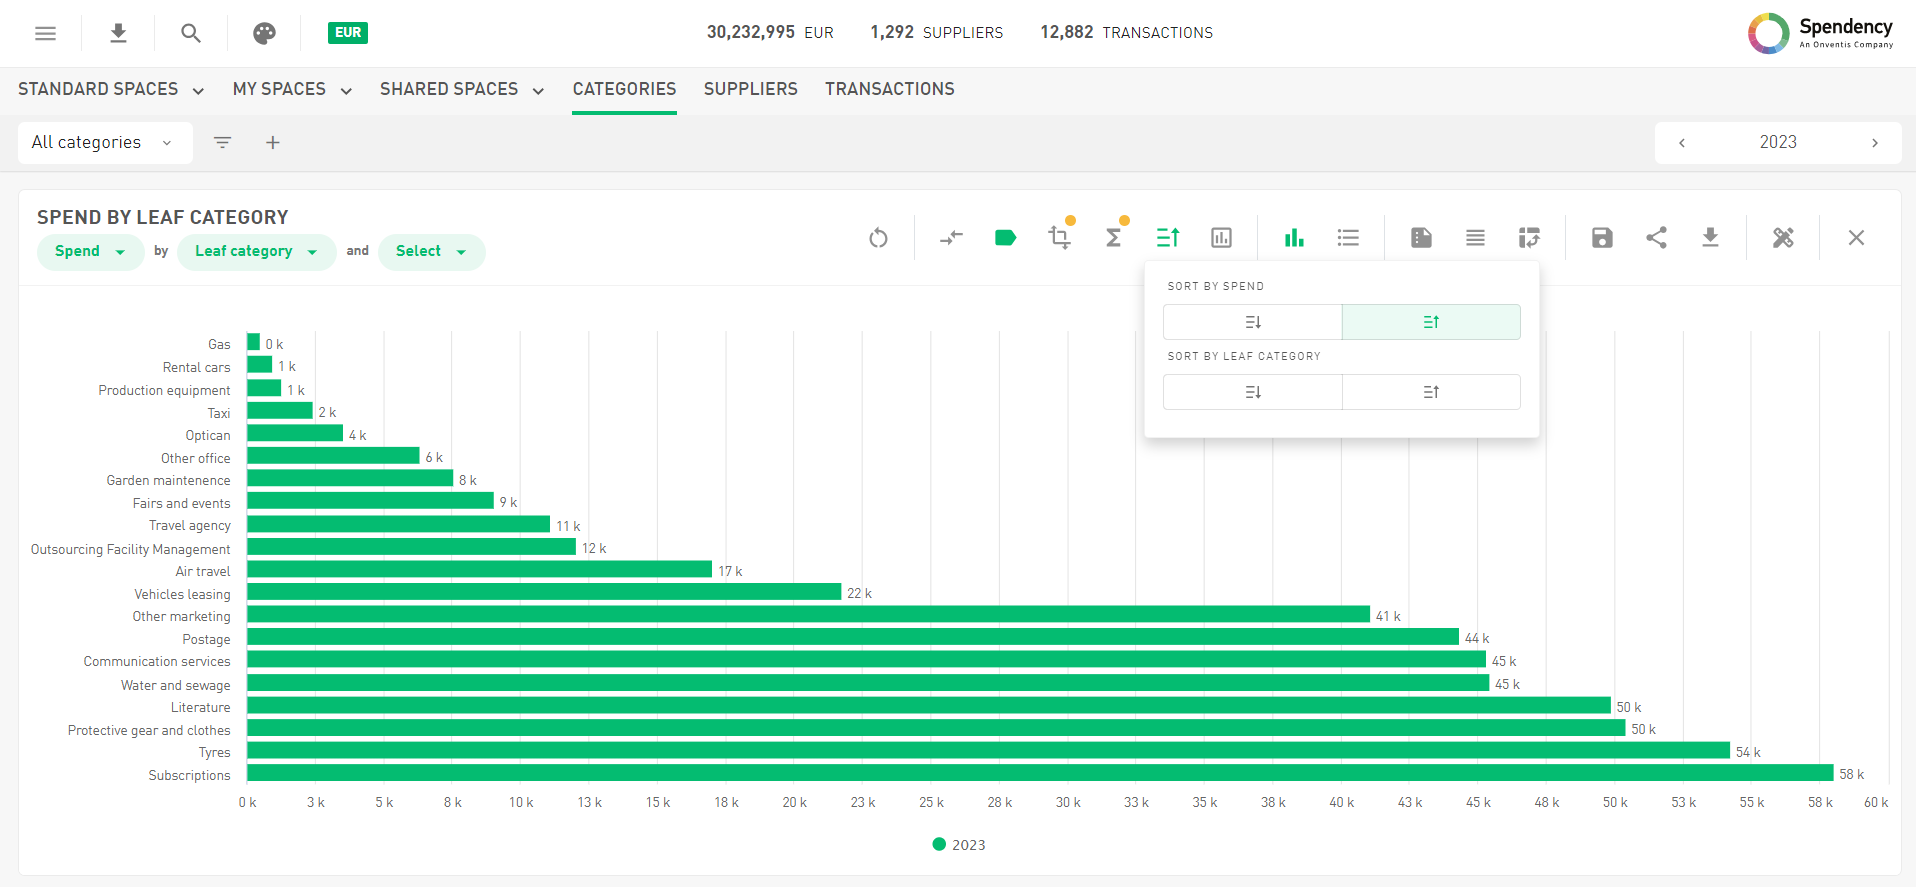
Exciting news! Now you can effortlessly sort your charts in both ascending and descending orders, granting you flexibility in analyzing your data. If you aim to dissect your data from a new angle, like looking at the categories with the lowest spend, this feature empowers you to do so with ease.
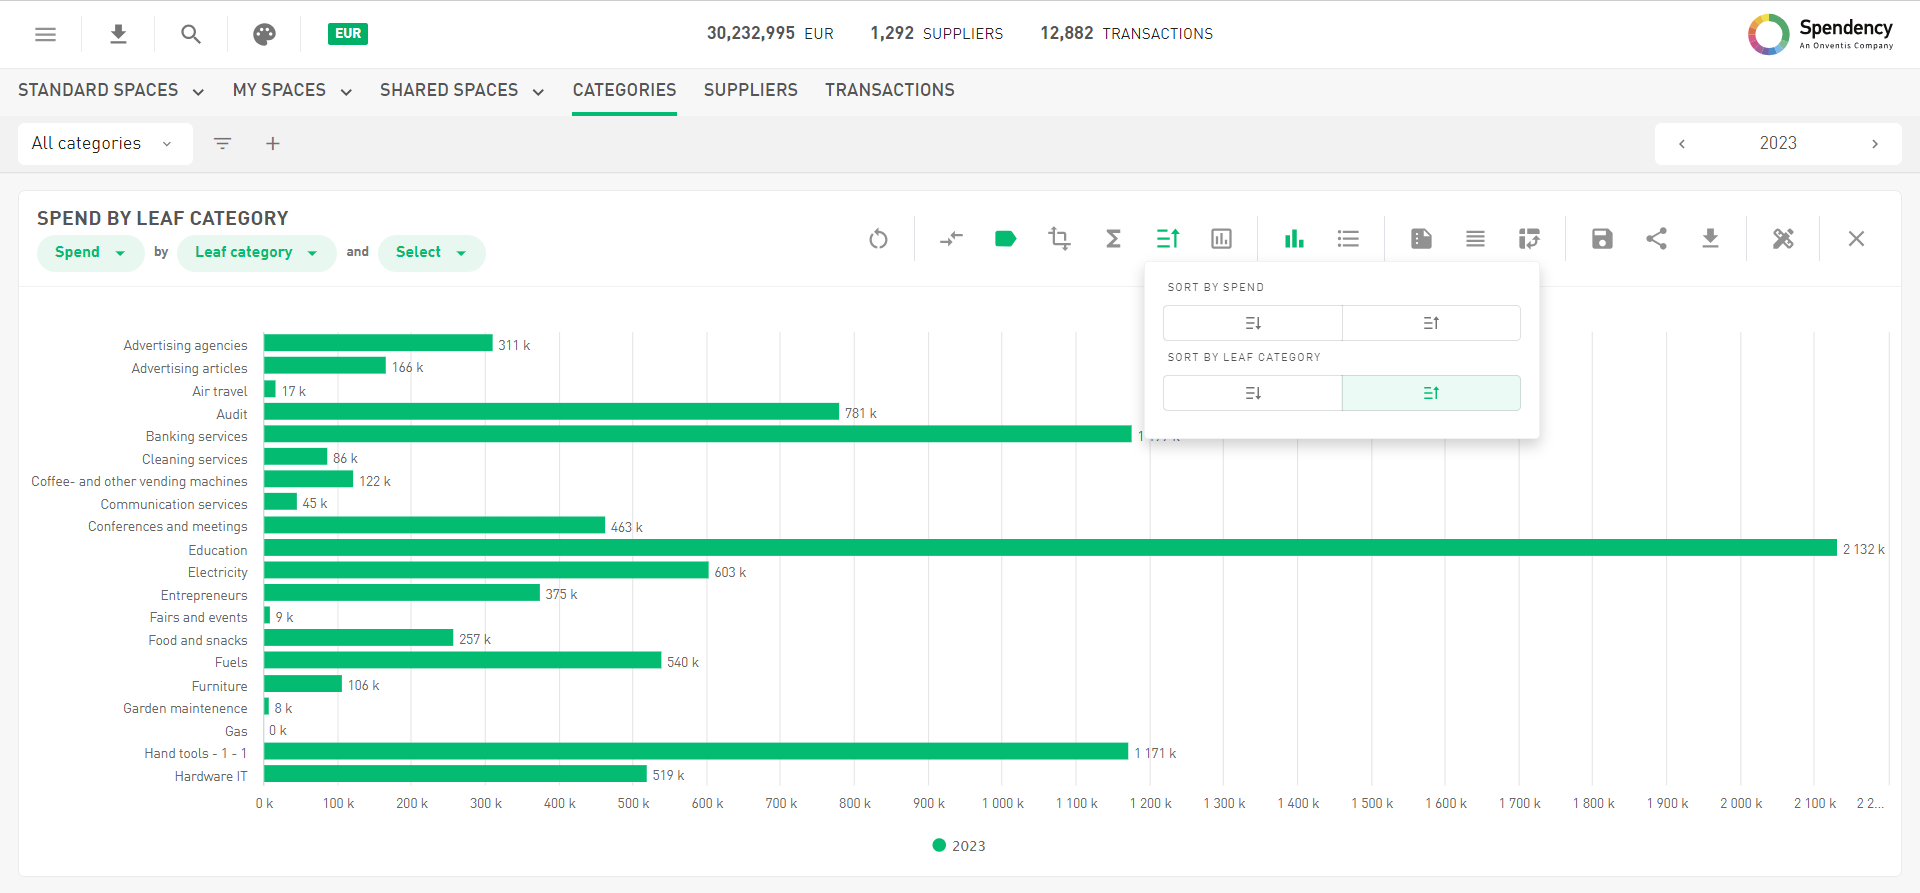
But wait, there's more! In addition to sorting amounts like spends or transaction counts in ascending and descending orders, you now have the ability to sort by the selected group by attribute. Let's delve deeper into the magic this brings for you.
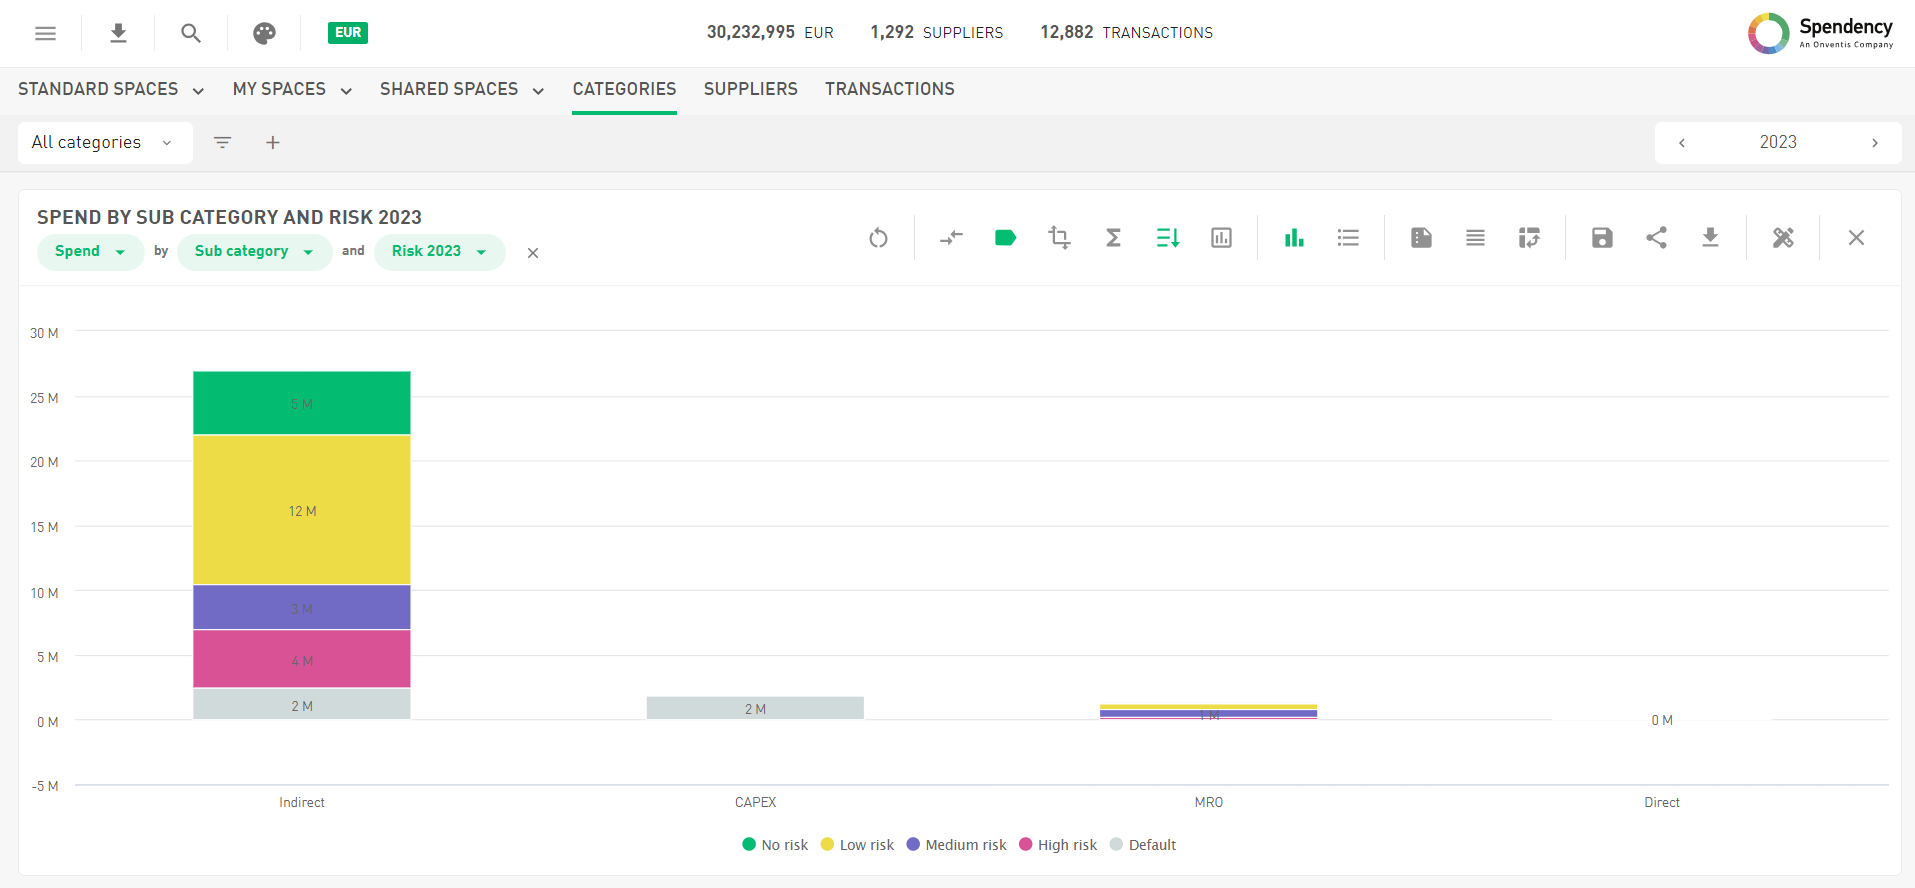
When sorting by tag values, your data will be meticulously organized based on the defined sort order of tag values, ensuring precision and accuracy in your analysis (see more on this in the next section). In other cases, when sorting by the group by attribute e.g. leaf categories, your data will seamlessly align alphabetically, providing you with a smooth and intuitive analytical journey.
Sort order in Tags
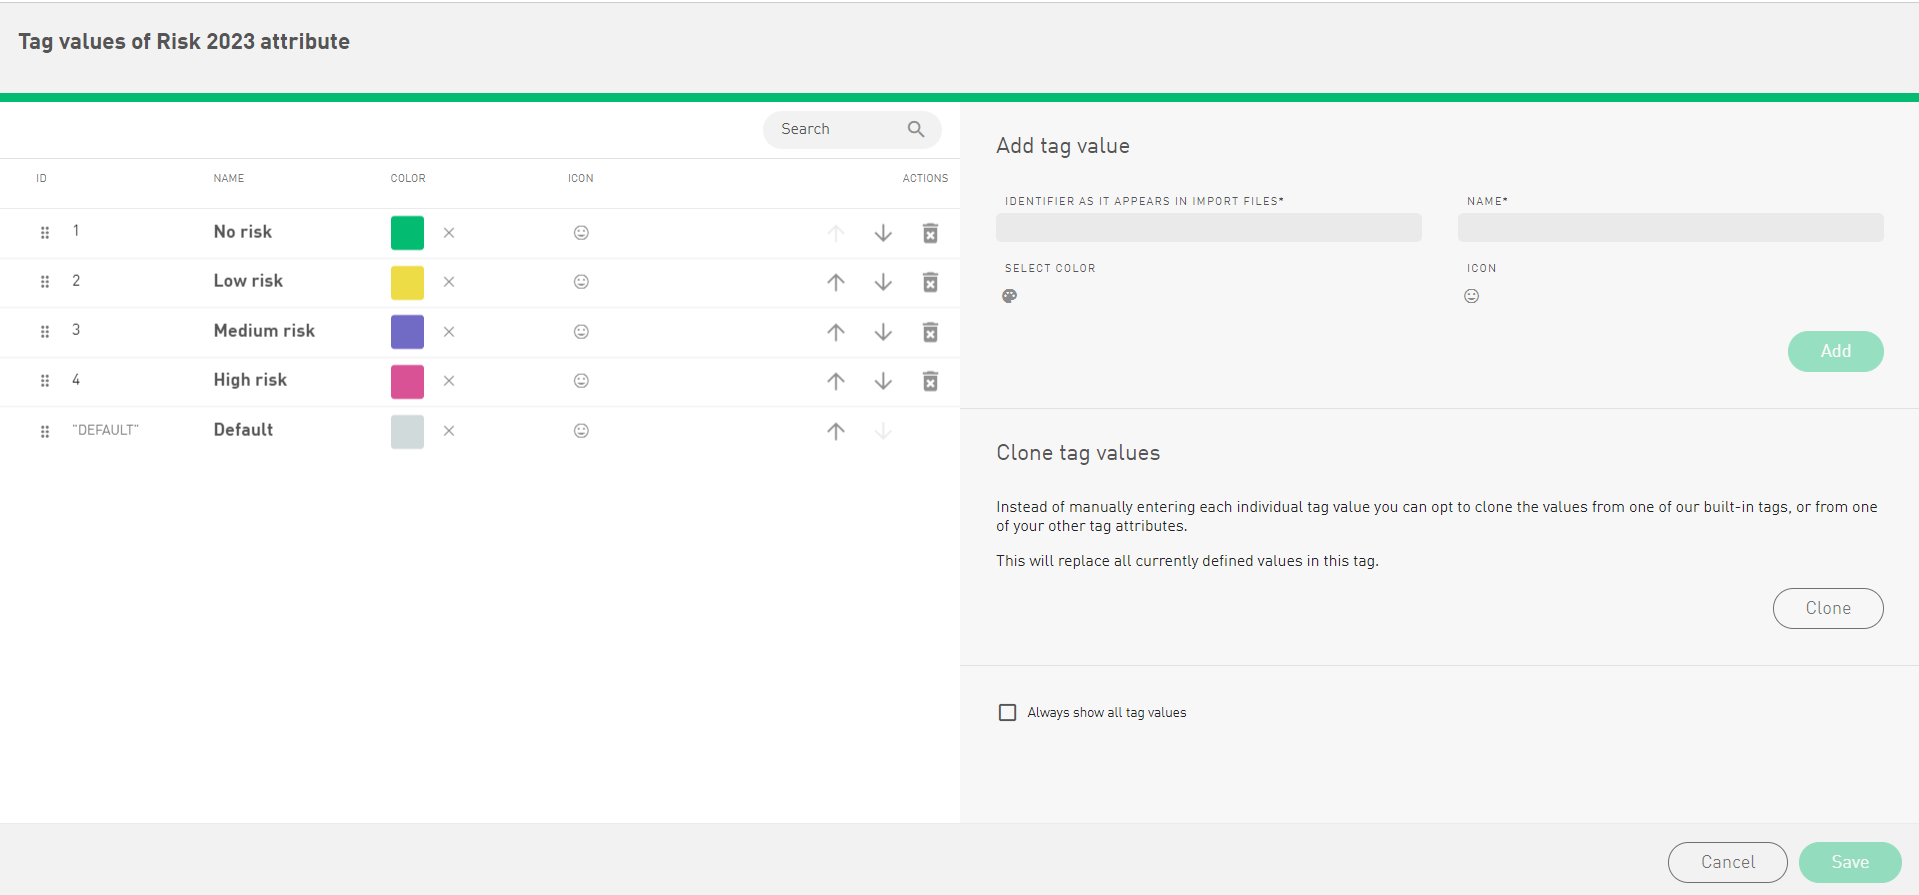
Put a magical touch on tag values. You are now able to define a sort order for tag values of an attribute.
With just a flick of your cursor, you can effortlessly drag tag values into their destined positions or utilize the convenient arrows on the right side to adjust their order. By setting a custom sort order, you ensure that your data aligns perfectly when conducting analyses on attributes such as Spend by Category and Risk.
Embrace the magic of precise data organization and unlock new realms of analytical accuracy!
Analyze Spend by Agreement
Now also available for Onventis Buyer Customers
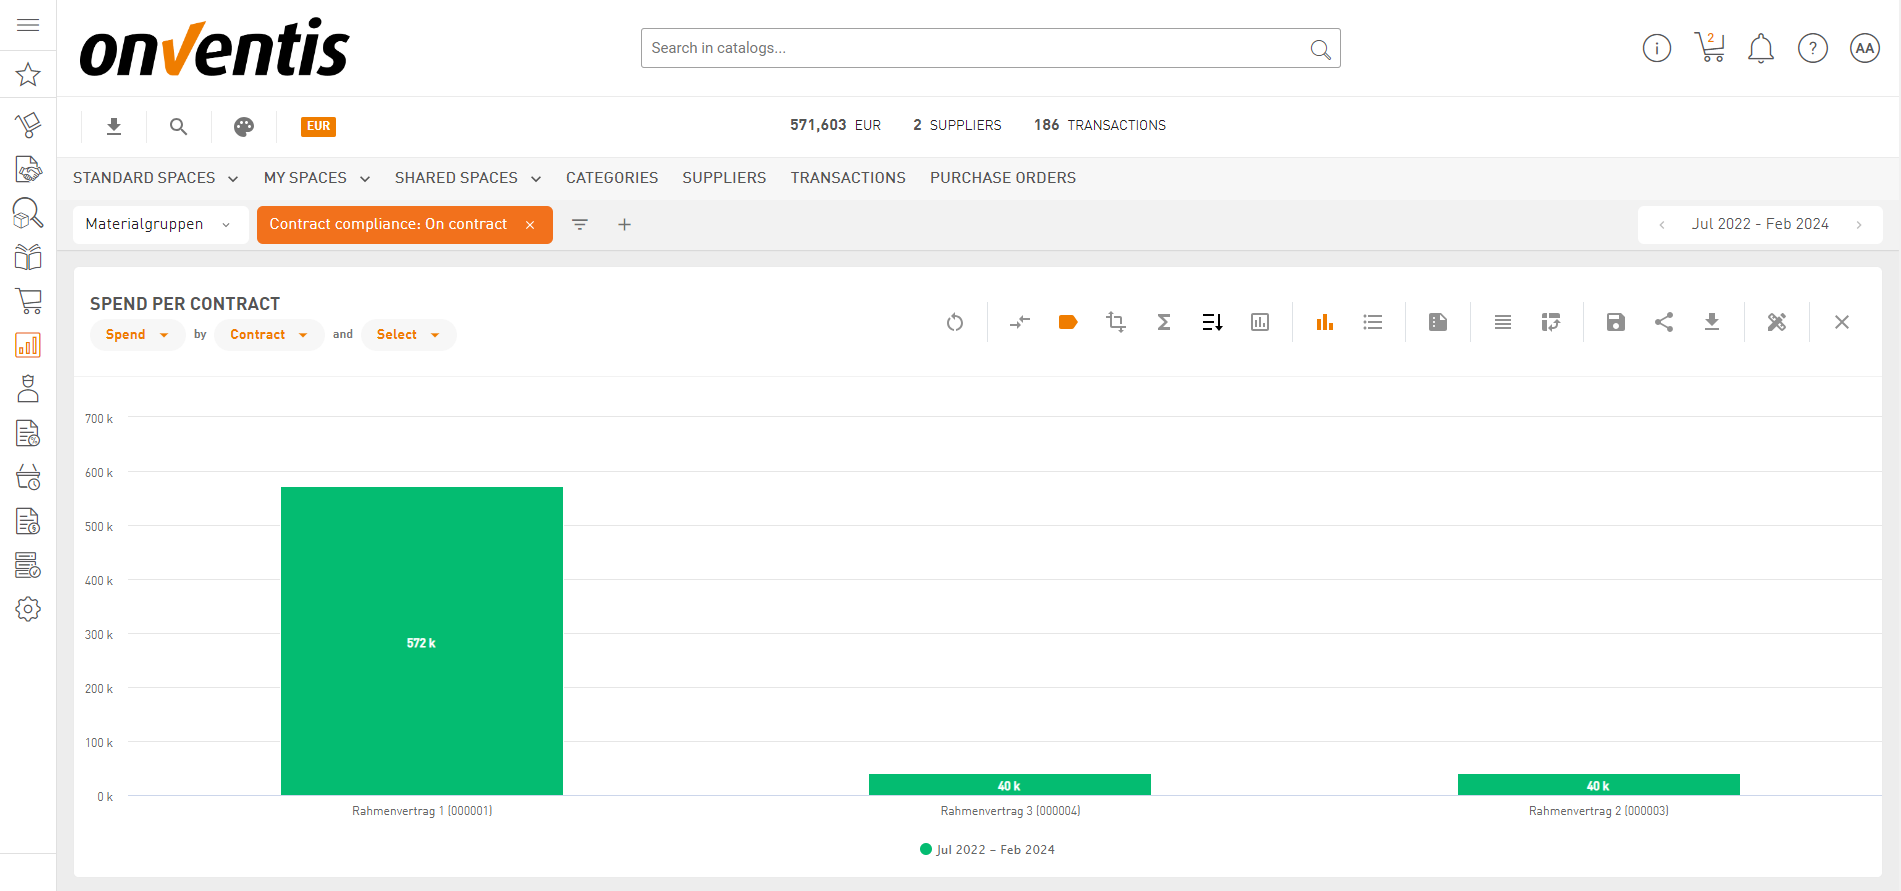
After much anticipation, we are pleased to announce that the powerful capability of conducting spend analysis by agreement is now also accessible for Onventis Buyer customers.
This game-changing feature empowers you to delve into detailed spend analysis, enabling precise filtering for individual agreements. Say goodbye to guesswork and hello to enhanced agreements insights! With the ability to filter spending for specific agreements, you can now gain deeper understanding and prevent overspending with ease.
But that's not all! In addition to this groundbreaking feature, we've made significant improvements across the board. Changes to the contract panel layout, filter structure, and contract compliance space have been implemented to streamline your contract management processes.
Furthermore, we're introducing the ability to define maximum contract values, giving you greater control over spending. This means better budget management, risk mitigation, compliance assurance, and more confident negotiations.
New filters have been added for easy monitoring of contract status, identifying overspent contracts, and managing missing contracts. Plus, enhancements in contract drilldown and the contract status dashboard provide quick access to critical insights, ensuring seamless contract management.
For more detailed information on these exciting updates, please explore the previous release notes (2024.1 & 2024.2) and take your contract management to new heights. Happy exploring! 🚀
New access right for Widgets
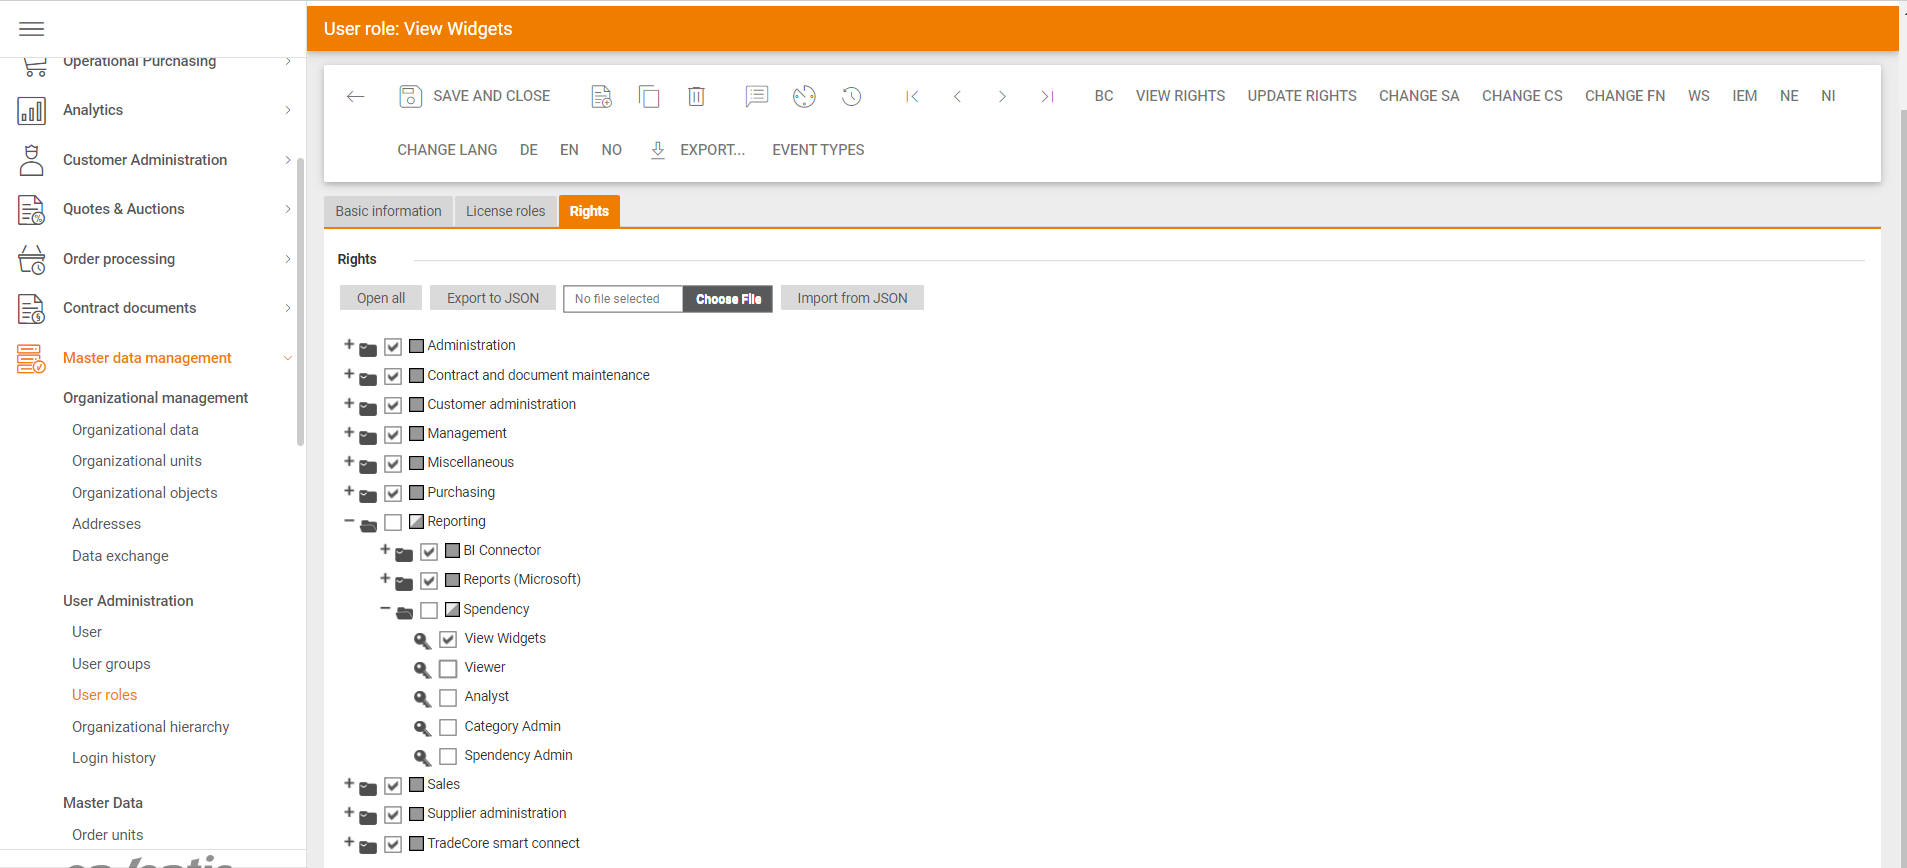
Introducing the "View Widgets" Access Right. This innovative feature grants users access to the widgets within the relevant product area, while maintaining strict control over data visibility in Onventis Analytics. With "Analytics" discreetly tucked away, users can focus on leveraging the widgets to drive informed decisions without unnecessary distractions.
If you want to read more about the widgets itself, please check out the 2024.3 Onventis Buyer release notes.
More Data from Onventis Buyer
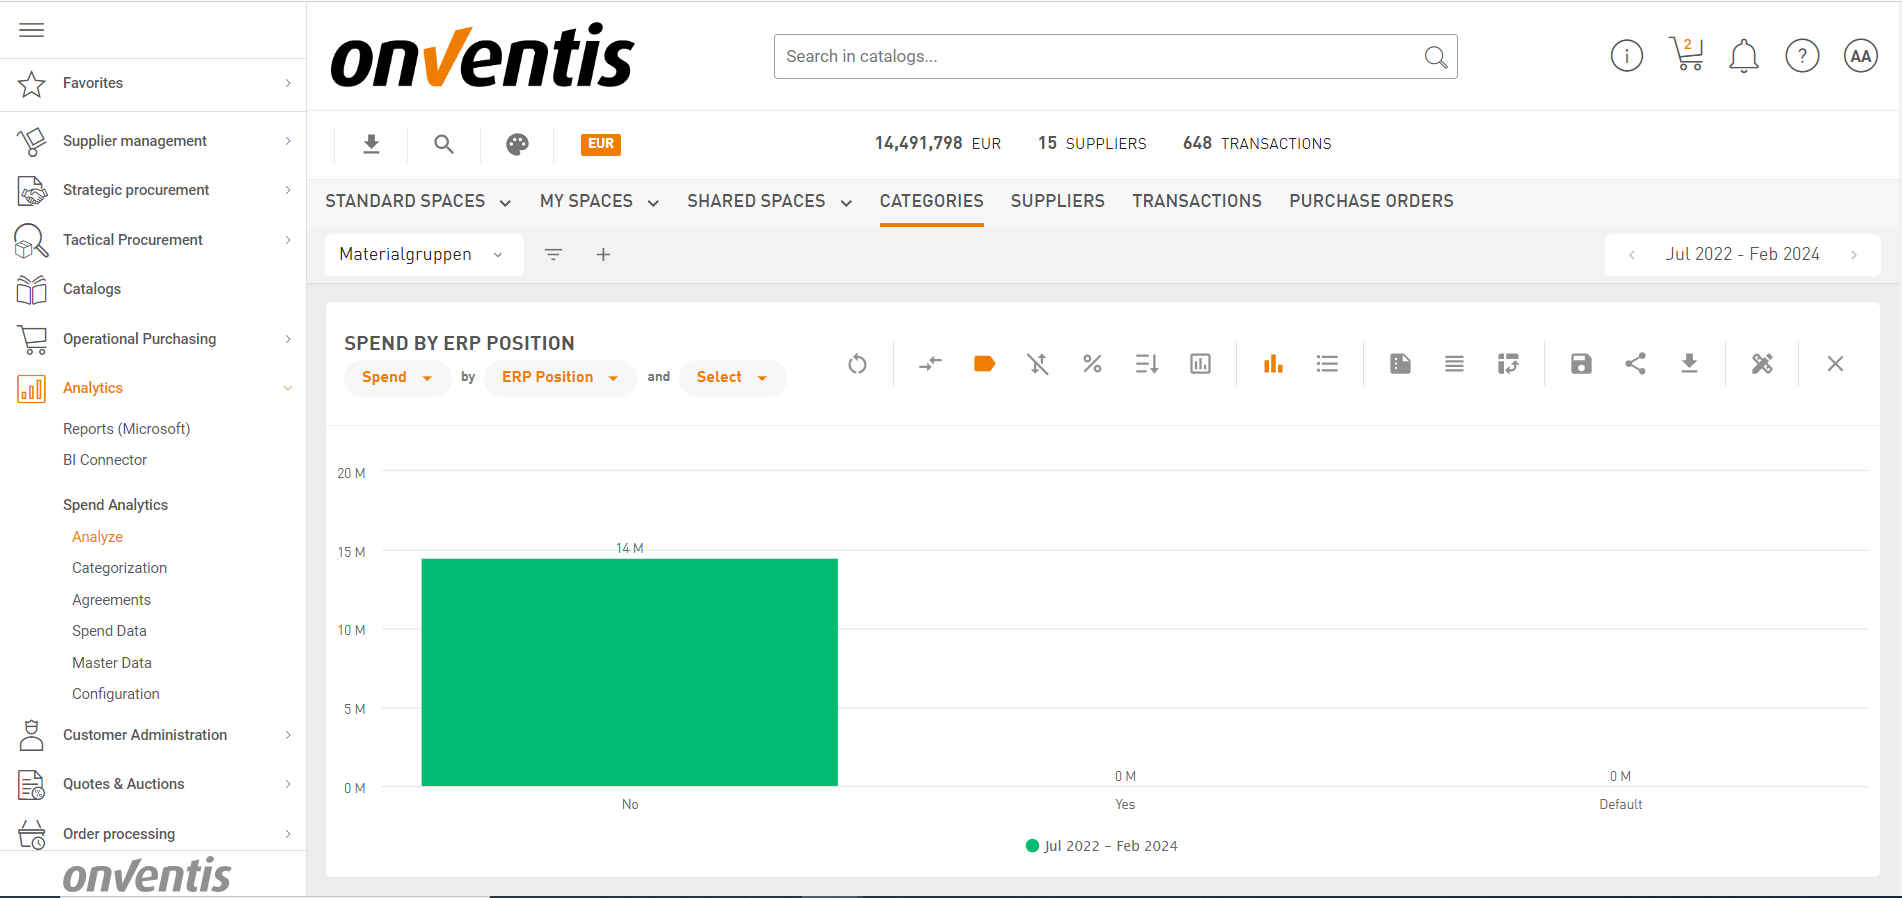
We've expanded our data elements from Onventis Buyer, unlocking new analysis possibilities. The information whether the purchase order line item is transferred from an ERP System is now also available in Onventis Analytics, waiting for you to be explored and analyzed.
