Onventis Analytics 2025.2
Welcome to Onventis Analytics 2025.2!
This release is all about smarter metrics, dynamic data, and deeper insights. We’re excited to introduce spend formula attributes — your new superpower for calculating custom KPIs directly in your master data. Combine fields, define logic, and tailor spend analysis to your exact needs. Alongside that, moving attributes now let you track how values change over time — ideal for managing fluctuating exchange rates, carbon intensities, or supplier scores.
And in Analyze? We’ve added powerful new features to help you explore, filter, and export your data more effectively than ever.
Ready to take your spend analytics to the next level? Let’s go:
2025.2 Release: May 2, 2025
New in Master Data 💸
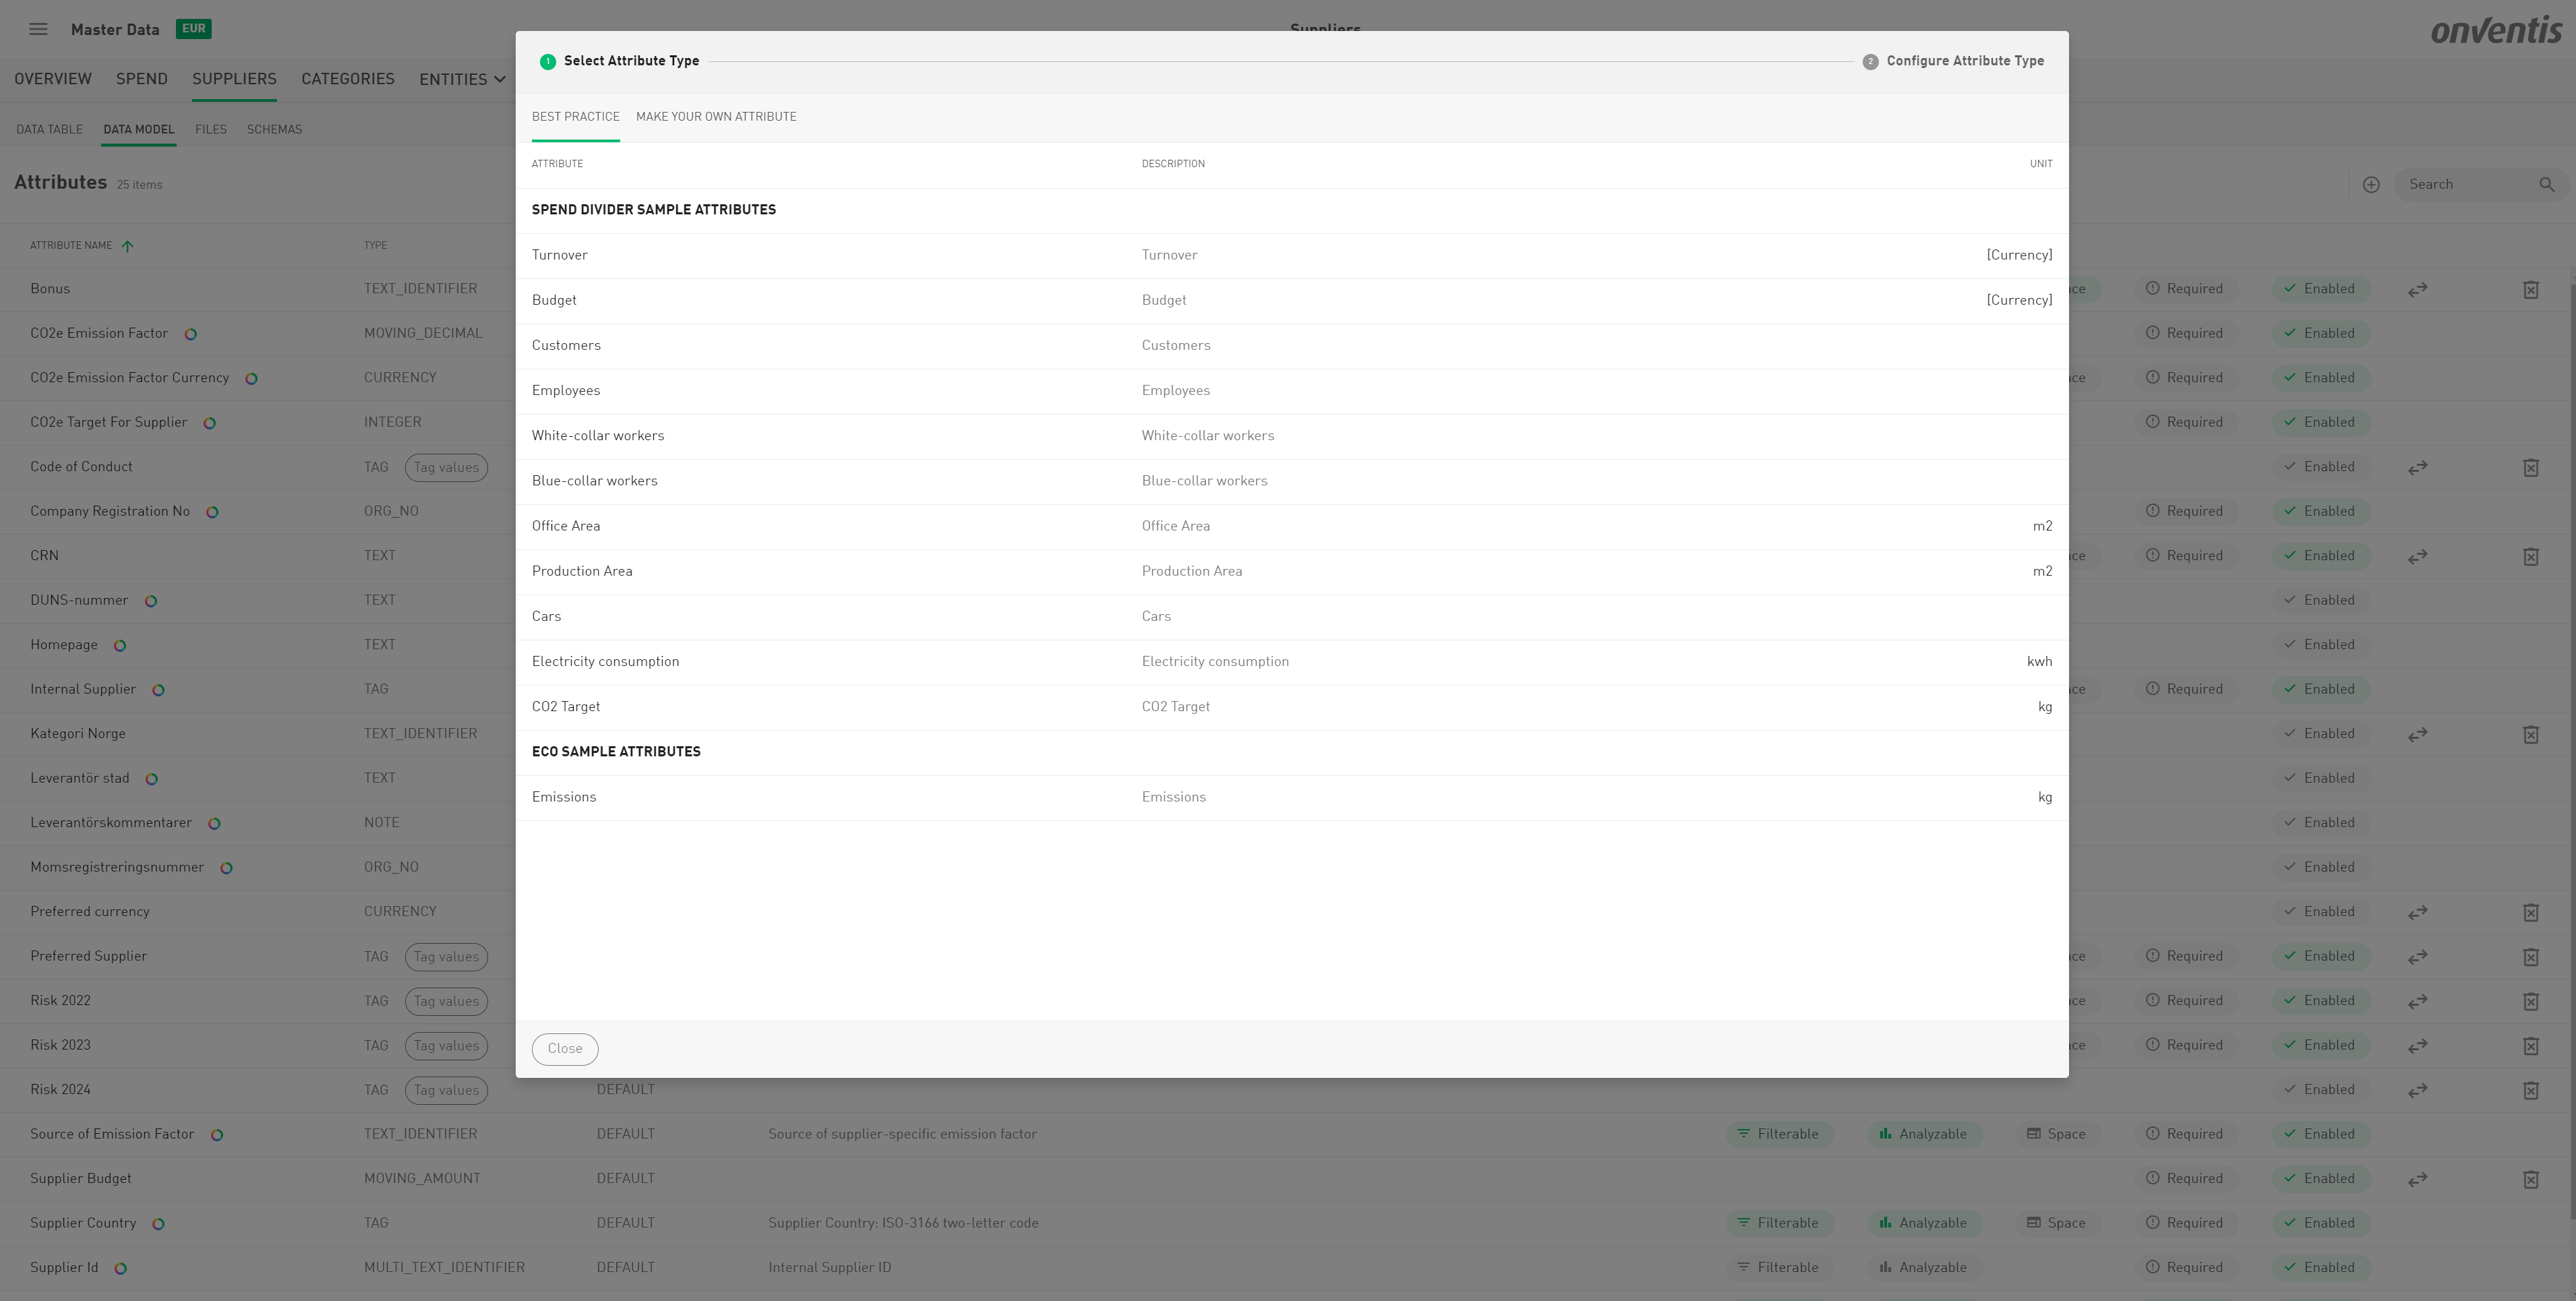
💡 New Attribute Type Selector: Don’t Start From Scratch – Use Best Practices
A lot has happened — and we’re excited to share it with you. It all starts with attributes, the foundation of any meaningful analysis. That’s why we’ve given our attribute type selector another makeover (yes, again!).
Not sure how to begin? We’ve made it easy. You now have the option to choose from curated best practice attributes — handpicked to boost the quality and depth of your analysis. Once selected, the setup is pre-filled and ready for your custom values.
Of course, you can still define your own attributes just like before — now with even more flexibility and improved usability. We’ve grouped the attribute types into three categories:
Standard
Special
Spend Formulas
Each category holds different types of attributes, tailored for specific use cases and analysis needs. You’ll find a detailed explanation and practical examples for each type directly in the system.
The real power lies in the new moving attribute types and spend formulas — and you’ll find everything you need to know about those in the next chapter.
🎯 New Attribute Types: “Moving Integer”, “Moving Decimal” and “Moving Amount”
Let’s face it — nothing stays the same forever. Headcounts grow. Budgets shift. Priorities change. And now, your data model can finally keep up.
With the introduction of the new “Moving Integer”, “Moving Decimal” and “Moving Amount” attribute types in Onventis Analytics, you can now manage data that changes over time without the hassle of creating a new attribute for each year or version.
These new types make your data model cleaner, smarter, and much closer to how things actually work in the real world.
📈 What is a “Moving Integer”?
A Moving Integer is an attribute that holds a whole number (no decimals!) that can vary over time. Instead of creating separate attributes like “Number of Employees 2023” and “Number of Employees 2024”, you just define one attribute — and track how its value changes over time using validity dates.
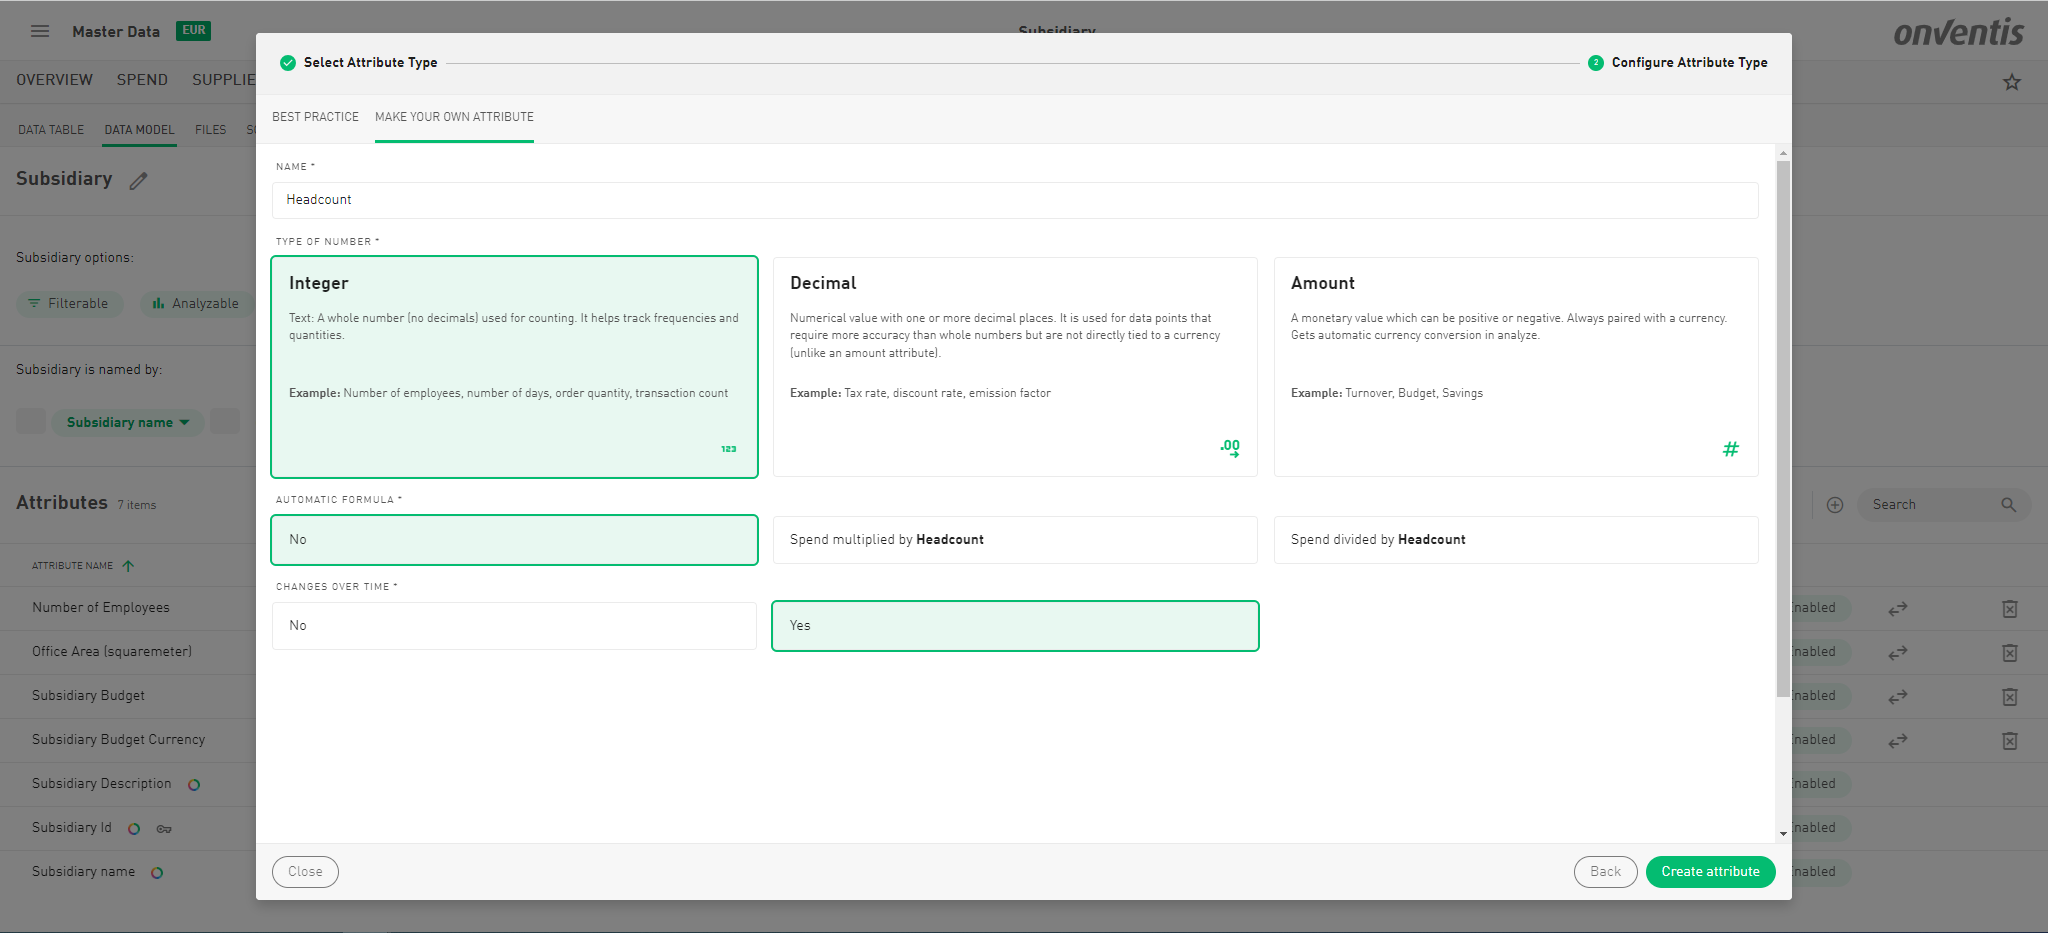
✅ When to Use Moving Integers
Perfect for anything you count — especially when those counts evolve:
Number of employees
Number of days
Priority or performance rankings
Headcounts in departments, regions, or business units
💡 Real-World Examples for Moving Integers
Attribute | Value | Valid From |
|---|---|---|
Employees in Finance | 50 | 01.01.2024 |
Employees in Finance | 60 | 01.01.2025 |
Attribute | Value | Valid From |
|---|---|---|
Supplier Spend Rank | 1 | 01.01.2024 |
Supplier Spend Rank | 2 | 01.01.2025 |
📊 What is a “Moving Decimal”?
A Moving Decimal is an attribute that tracks decimal values (yes, those with digits after the comma!) that change over time. It’s perfect for percentages, rates, or any value that requires more precision than an integer — but isn’t tied to a currency like a Moving Amount.
Instead of maintaining multiple attributes like “CO₂ Factor 2023” and “CO₂ Factor 2024”, you define one clean attribute and simply update its value over time with validity dates.
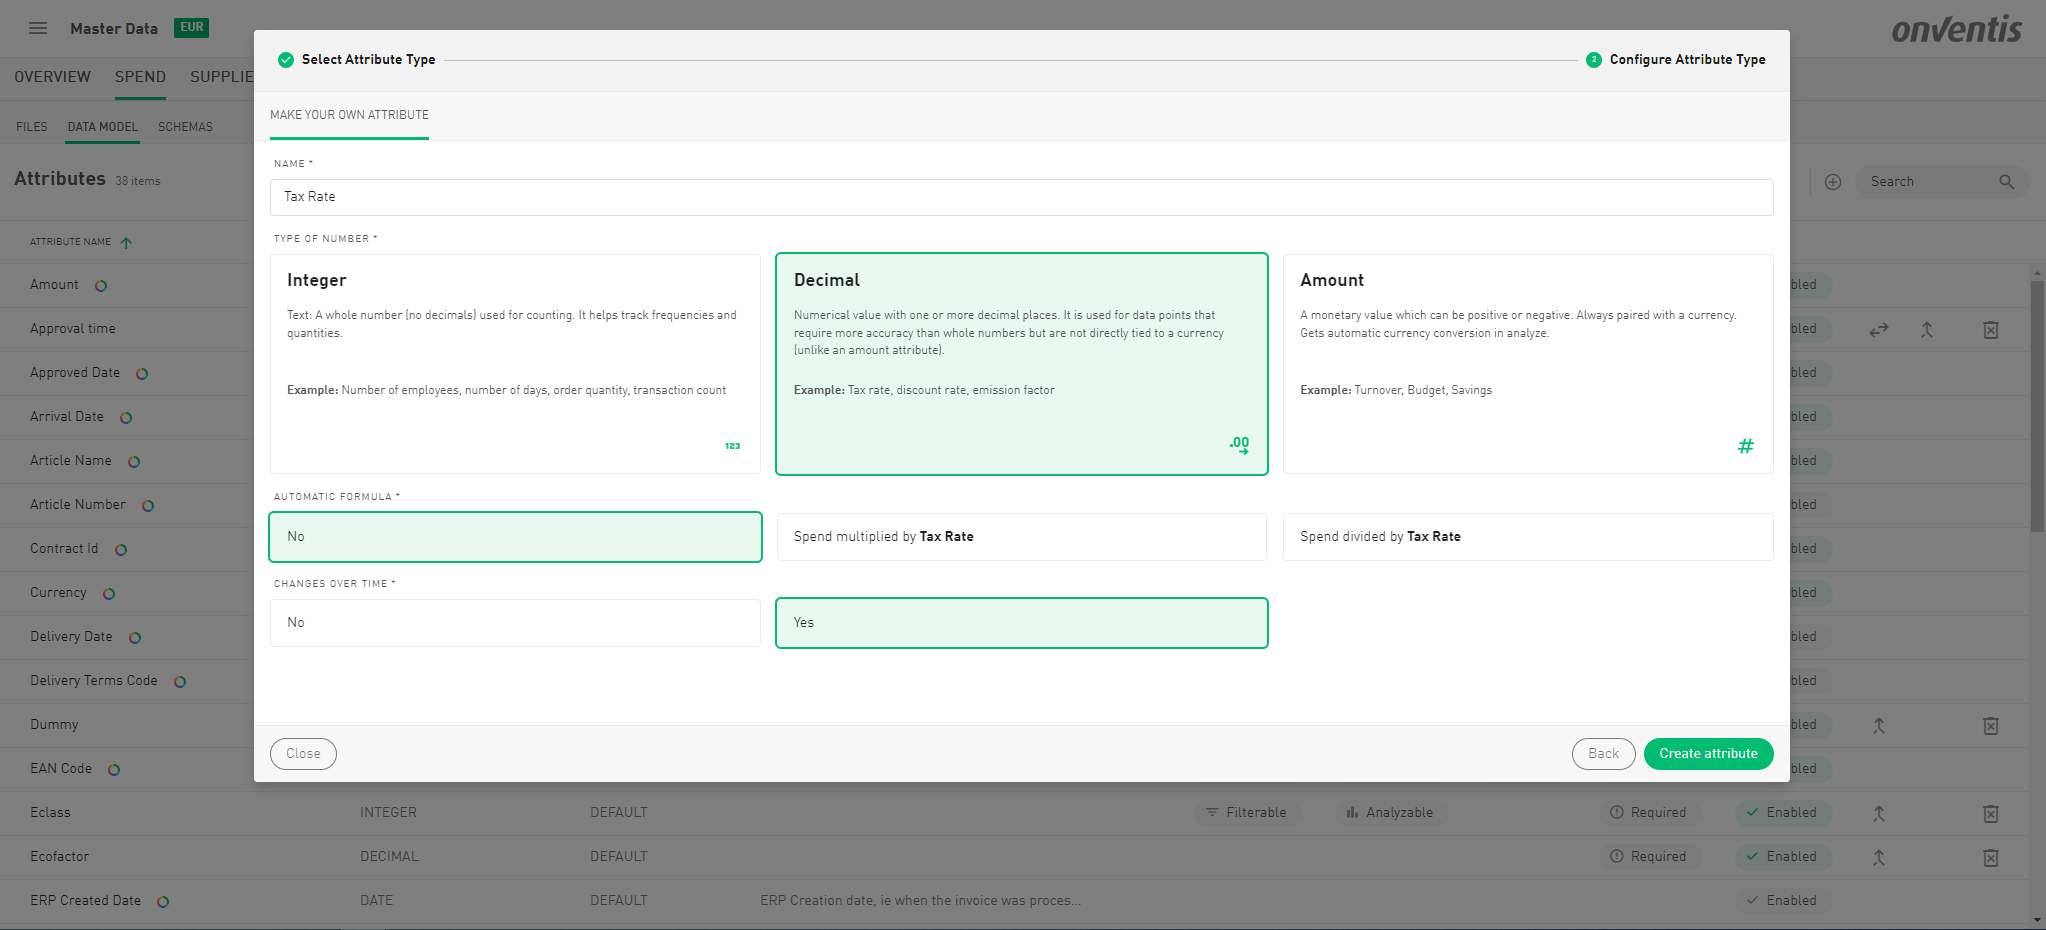
✅ When to Use Moving Decimals
Ideal for values that are precise, time-dependent, and not monetary:
Tax rates
Discount rates
Emission factors
Efficiency ratios
Conversion rates
💡 Real-World Examples for Moving Decimals
Attribute | Value | Valid From |
|---|---|---|
CO₂ Emission Factor | 0.28 | 01.01.2023 |
CO₂ Emission Factor | 0.26 | 01.01.2024 |
Attribute | Value | Valid From |
|---|---|---|
VAT Rate | 0.19 | 01.01.2024 |
VAT Rate | 0.21 | 01.01.2025 |
🔧 Why It Matters
Whether you’re adjusting emissions data or accounting for tax rate changes, Moving Decimals let you capture reality without clutter. You define one attribute, and Onventis Analytics keeps track of its changes over time — so your model stays accurate, future-proof, and easy to maintain.
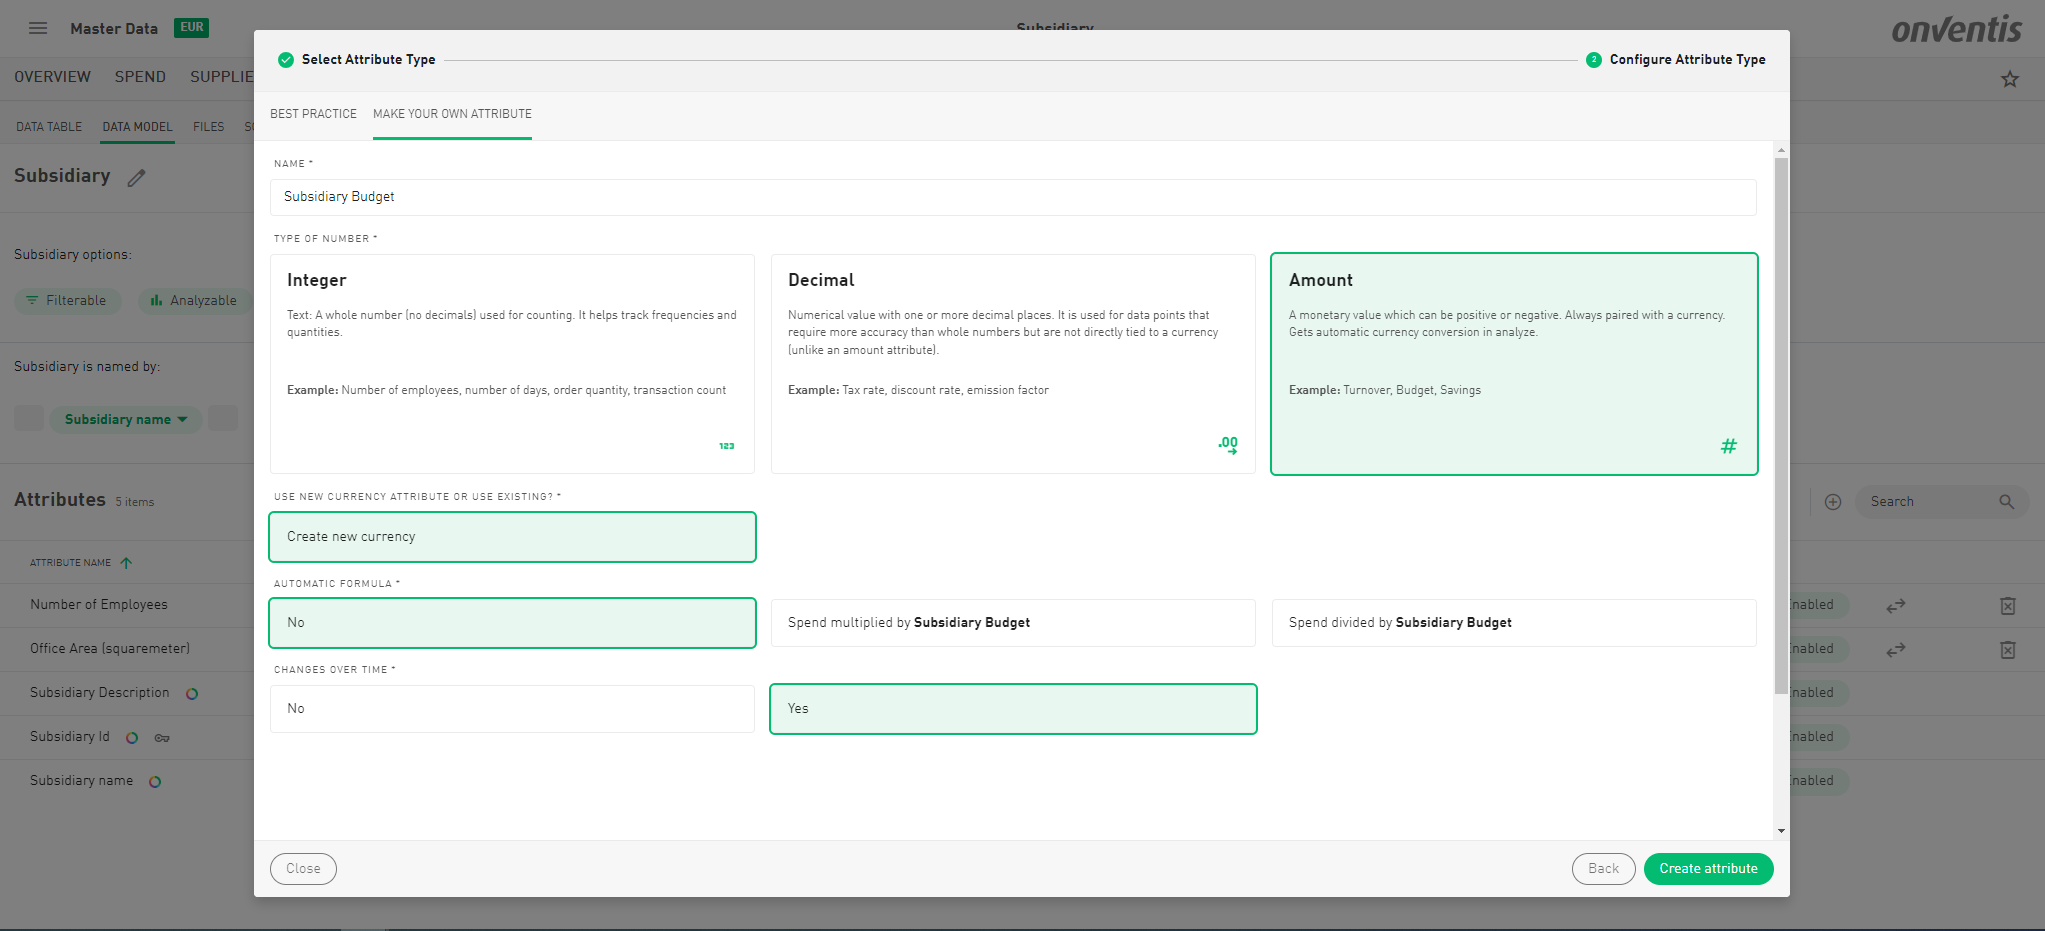
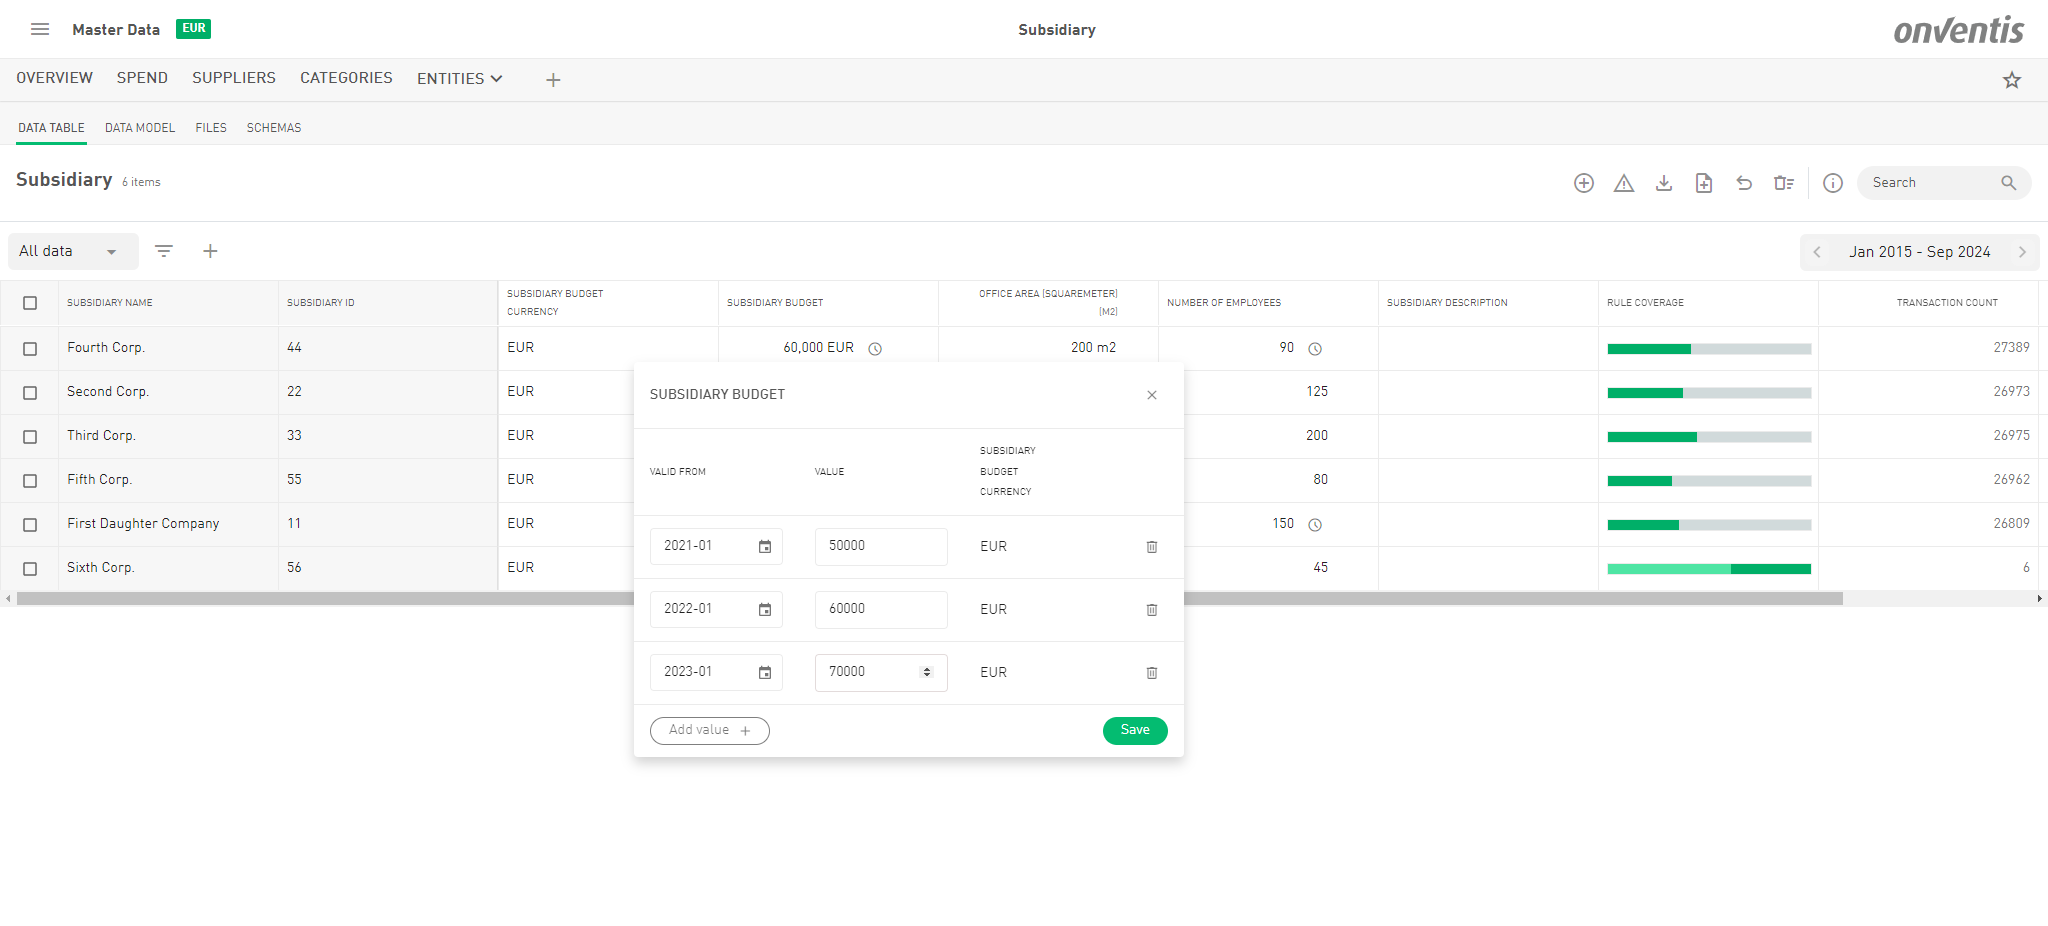
💶 What is a “Moving Amount”?
A Moving Amount tracks monetary values that can change over time — always paired with a currency and potentially even negative (for refunds, losses, etc.). Think of this as the go-to type for evolving financial figures like turnover, savings, or budgets.
No need to create separate attributes like “Turnover 2023” or “Turnover 2024” anymore. One attribute does the job — and you assign different values along with their effective start dates.
✅ When to Use Moving Amounts
Revenue / Turnover
Spend
Budgets
Financial forecasts
Savings or cost avoidance
💡 Real-World Examples for Moving Amounts
Attribute | Value | Currency | Valid From |
|---|---|---|---|
Turnover | 2,000,000 | EUR | 01.01.2023 |
Turnover | 2,500,000 | EUR | 01.01.2024 |
Attribute | Value | Currency | Valid From |
|---|---|---|---|
Budget for IT | 300,000 | USD | 01.01.2024 |
Budget for IT | 280,000 | USD | 01.01.2025 |
⚠️ Quick Note on Amounts
When using Moving Amounts in formulas, keep in mind:
These are total values valid from a specific date onward — they are not amortized or automatically distributed across time.
We don’t (yet) support time-based allocation or depreciation models.
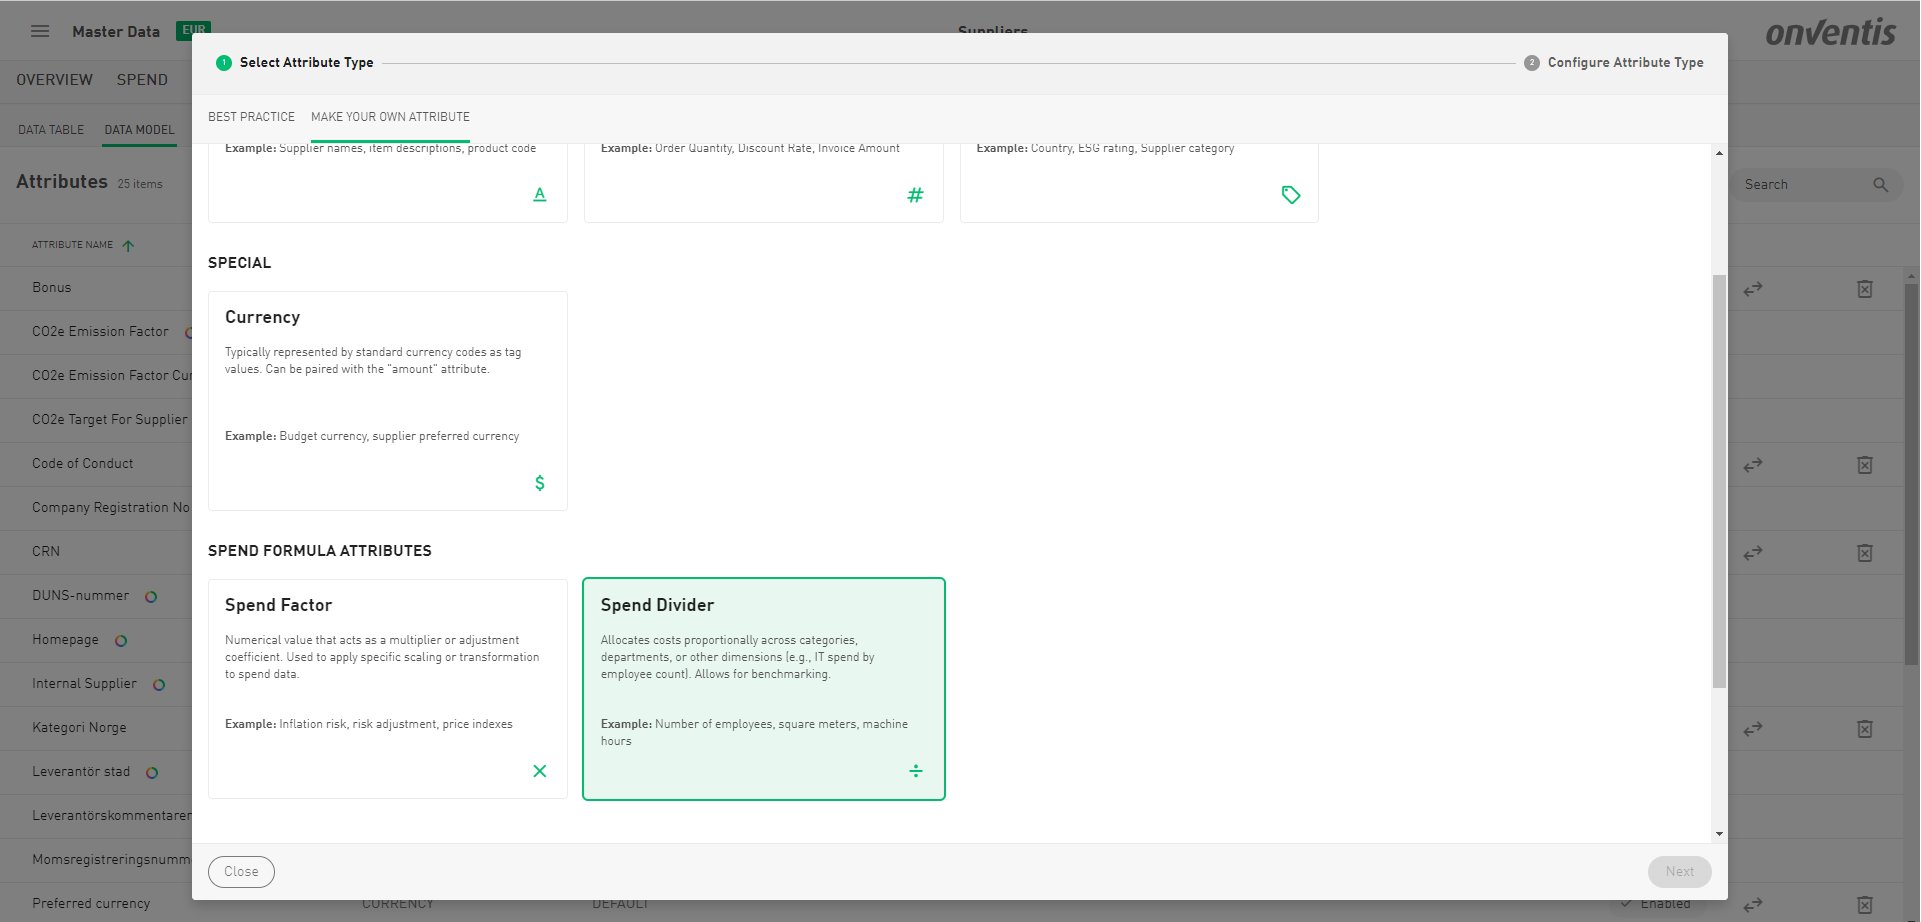
🧮 New Feature: Do the Math with Your Spend!
Say hello to smarter spend insights! You can now use formulas to enhance your spend data by applying multipliers and dividers—directly within your analytics. Whether you want to adjust for inflation, allocate costs, or benchmark departments more accurately, our new Spend Formulas have you covered.
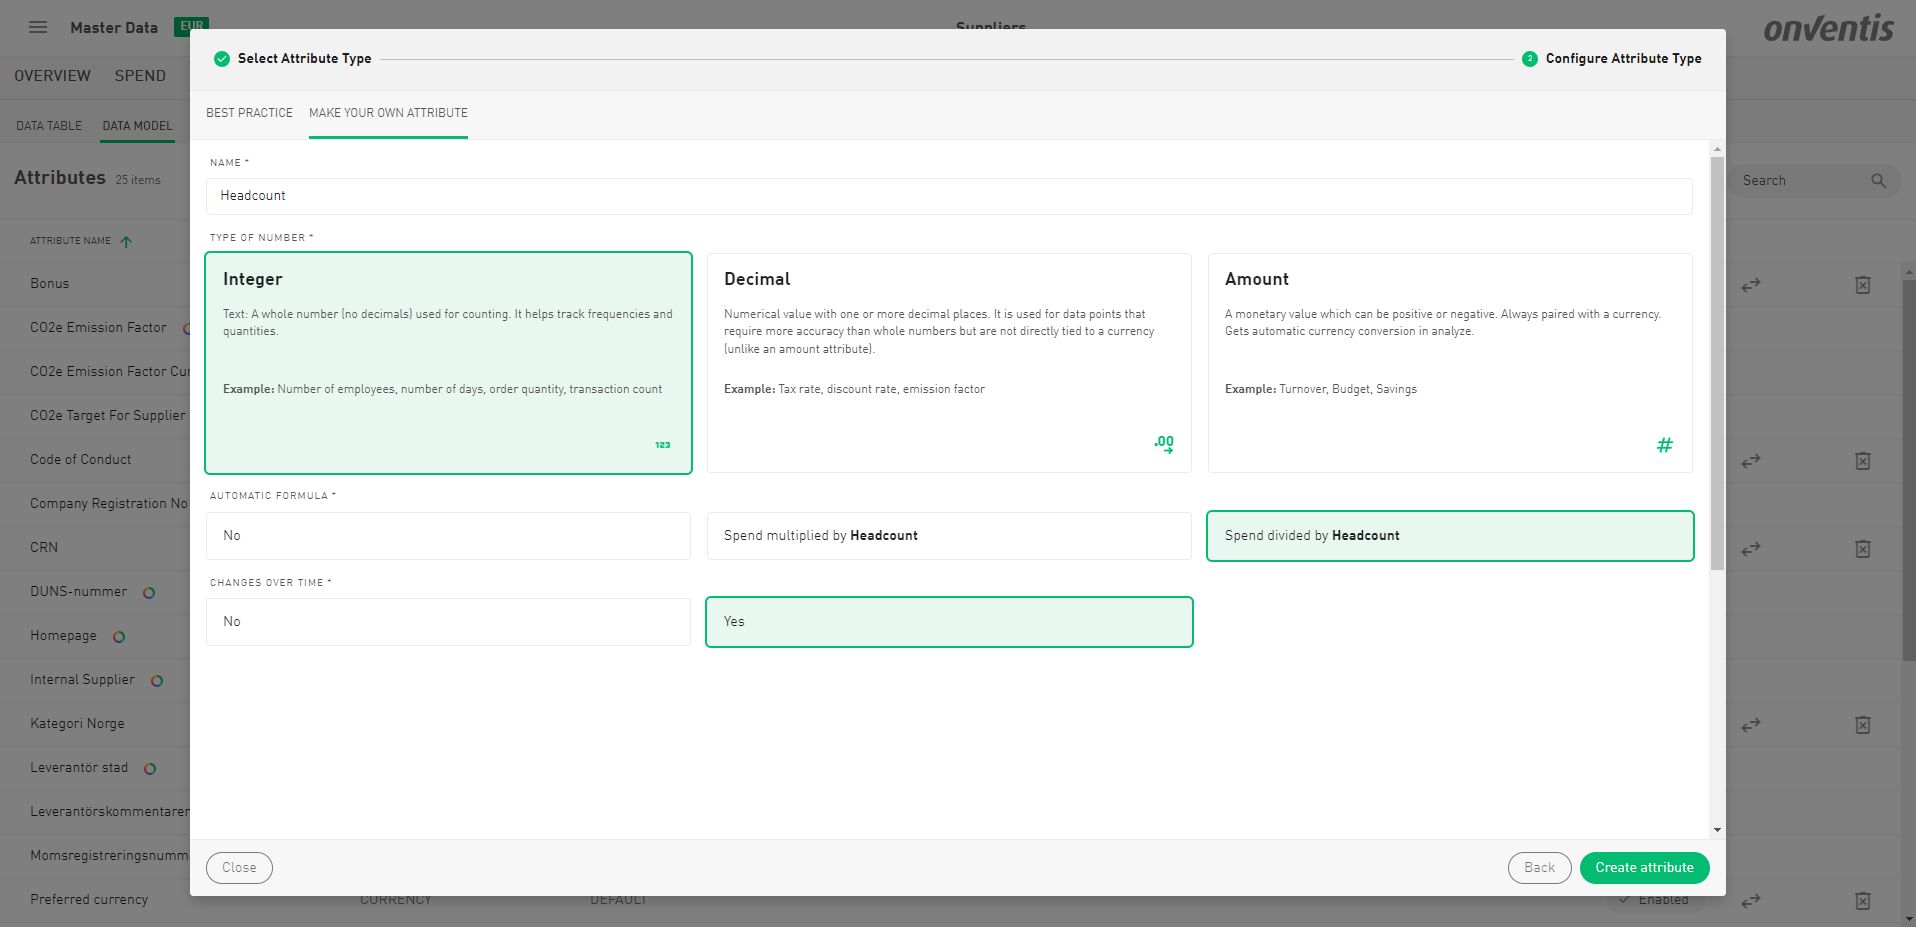
A Spend Formula isn’t a separate attribute type — it's a special way of using a number-based attribute (integer, decimal, or amount) to dynamically adjust your spend. These number attributes can be used in two ways:
As a multiplier (Spend Factor)
As a divider (Spend Divider)
They can be:
Static: A fixed value that stays the same over time
Moving: A dynamic value that changes over time — e.g. monthly headcount updates, quarterly index changes, etc.
💡 If you’re already using Moving Integers, Moving Decimals or Moving Amounts, you’ll feel right at home — Spend Formula Attributes build on the same logic to create deeper insights.
What’s a Spend Formula Attribute?
A Spend Formula Attribute is a numerical value (integer, decimal, or amount) that modifies your spend to give you deeper insights. These attributes can either be:
✖️ Spend Factor – Multiply Your Spend | ➗ Spend Divider – Break It Down Fairly | |
|---|---|---|
Description | A multiplier that adjusts your spend value. Applied directly to increase or decrease spend values. | A divider that allocates or distributes spend proportionally across dimensions like departments, regions, or categories. Useful for internal benchmarking and performance comparisons. |
Use cases |
|
|
Static |
|
|
Moving |
|
|
🧩 Connect the Dots: Moving Attributes + Spend Formulas
Now that you know what Moving Integers, Moving Decimals, and Moving Amounts are — and how Spend Formulas work — let’s put it all together and explore how to actually use these in practice.
Spend Formulas become incredibly powerful when combined with Moving Number Attributes — because in the real world, the numbers that shape your decisions don’t stand still. Headcounts grow. Risk levels fluctuate. CO₂ emission factors evolve. And your spend analysis should be able to reflect that.
That’s where the magic happens: by linking dynamic, time-aware attributes with your spend data, you unlock the ability to analyze not just what you’re spending, but how efficiently, fairly, or sustainably you’re spending it — over time.
Let’s break this down with a few practical scenarios.
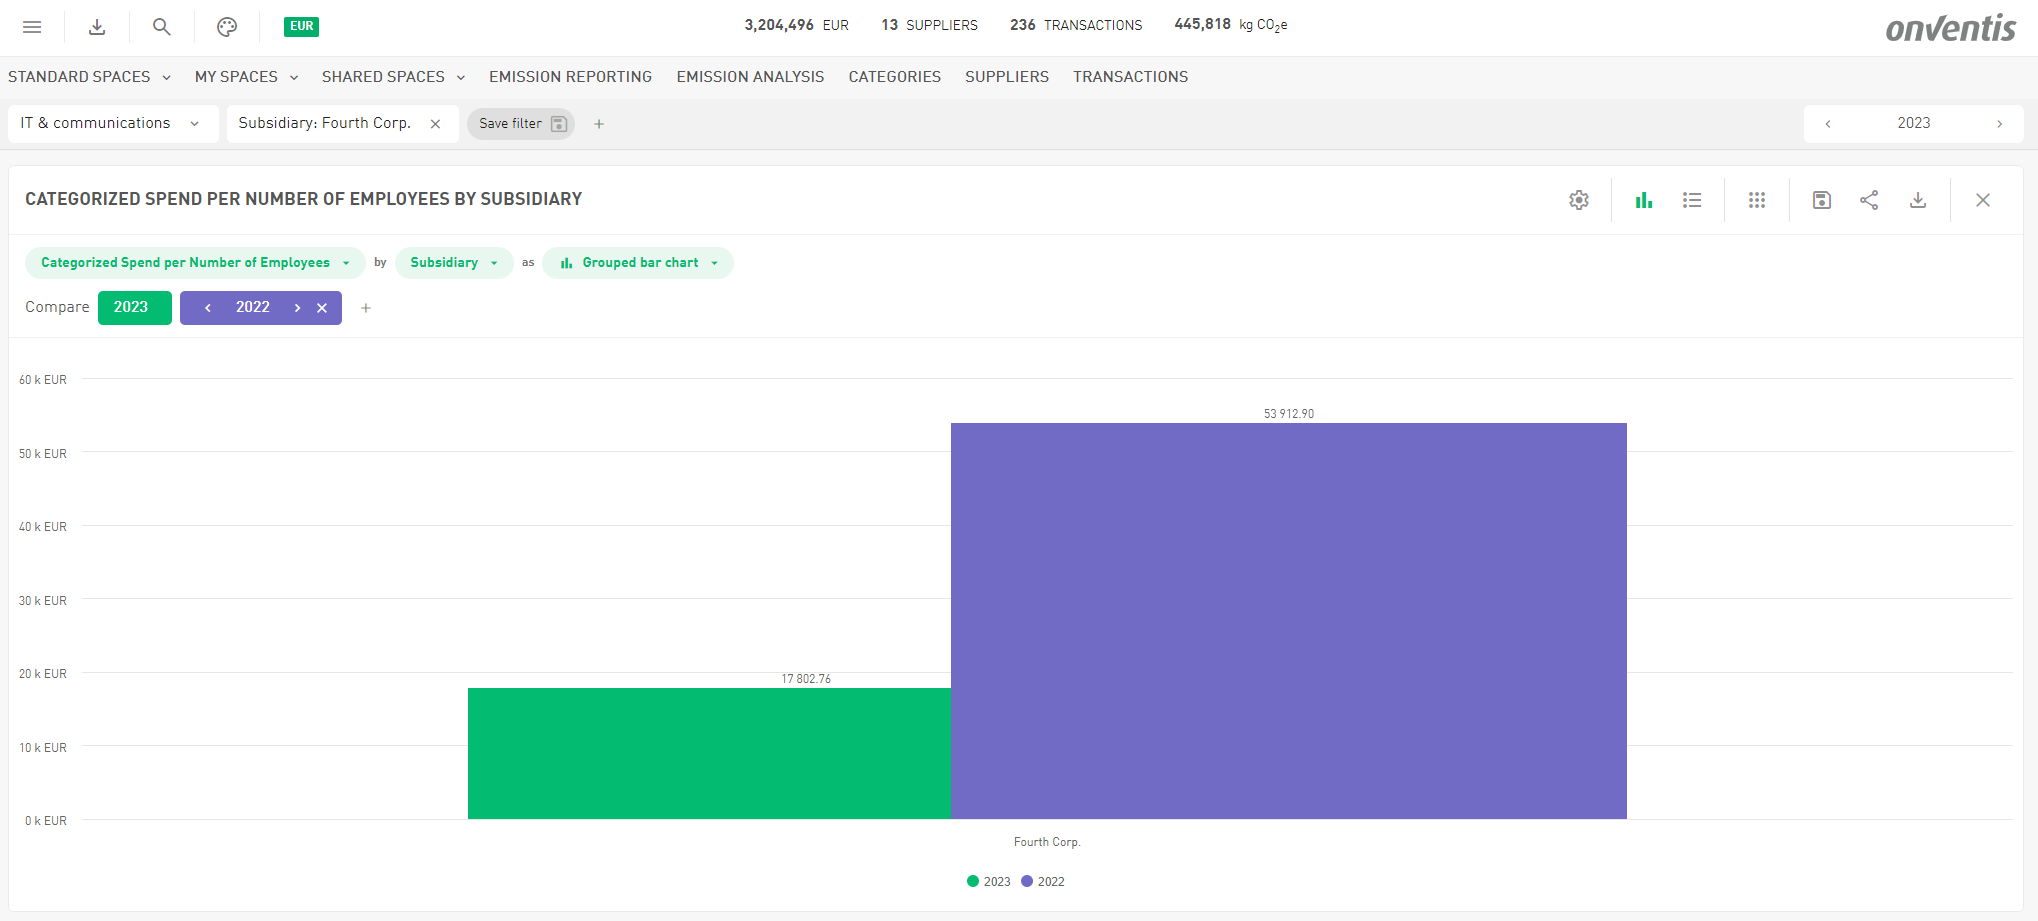
🧠 Example : Spend per Employee — Over Time
Let’s say you want to measure how efficiently each department spends budget over time. Instead of just dividing total spend by a static headcount, you use a Moving Integer attribute like Number of Employees (which changes each year), and define it as a Spend Divider.
✅ This helps you understand how spend efficiency evolves — even if spend stays flat or decreases.
Department | Spend | Employees (Valid From) | Spend per Employee |
|---|---|---|---|
IT | €300,000 | 30 (01.01.2024) | €10,000 |
IT | €280,000 | 35 (01.01.2025) | €8,000 |
📉 Decimals as Percentages — Smarter Input, Smarter Insights
Working with percentages just got a whole lot easier.
You can now enter decimal numbers with a percentage sign (%), and our system will automatically interpret them correctly — no extra formatting needed. Whether you're typing directly into Onventis Analytics or uploading values via a spend file, we'll know exactly what you mean.
✅ Why It Matters
This small change has a big impact on usability. No more second-guessing if you need to enter 0.2 or 20%. Just type what you see in your source documents, and Onventis Analytics does the rest.
Typing
12.5%is now recognized as0.125Entering
75%will be stored as0.75Uploading a spend file with a column like
Tax RateorDiscountfilled with percentages? No problem — we’ll read and convert them automatically
🏢 New Default Entity: Organization
We’ve added a new default entity called “Organization” — your digital representation of the company. It’s designed to work seamlessly with Spend Formulas and Moving Attributes to bring context and flexibility to your analysis.
The Organization entity comes with built-in attributes like:
Turnover (Moving Amount)
Number of Employees (Moving Integer)
Company Cars (Moving Integer)
Office Area (m²) (Moving Decimal or Integer)
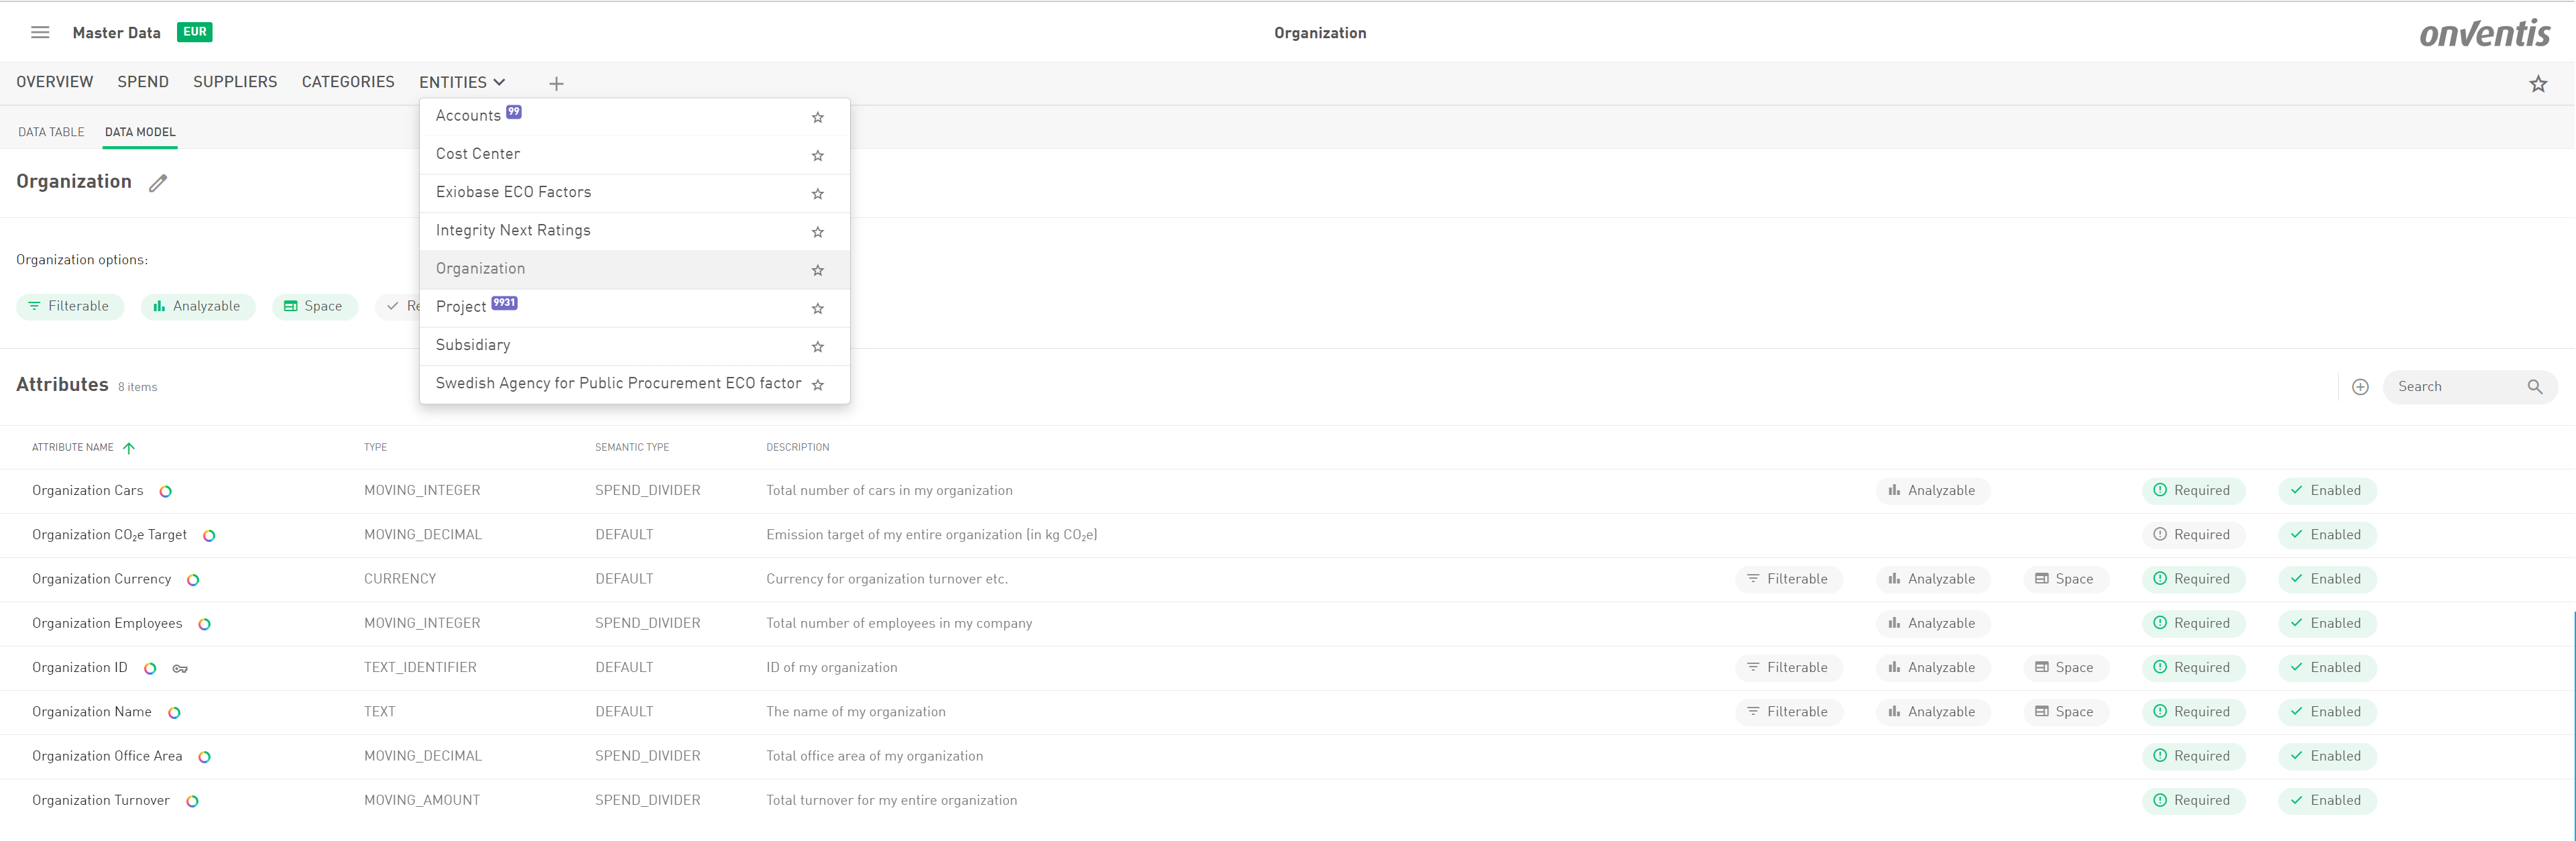
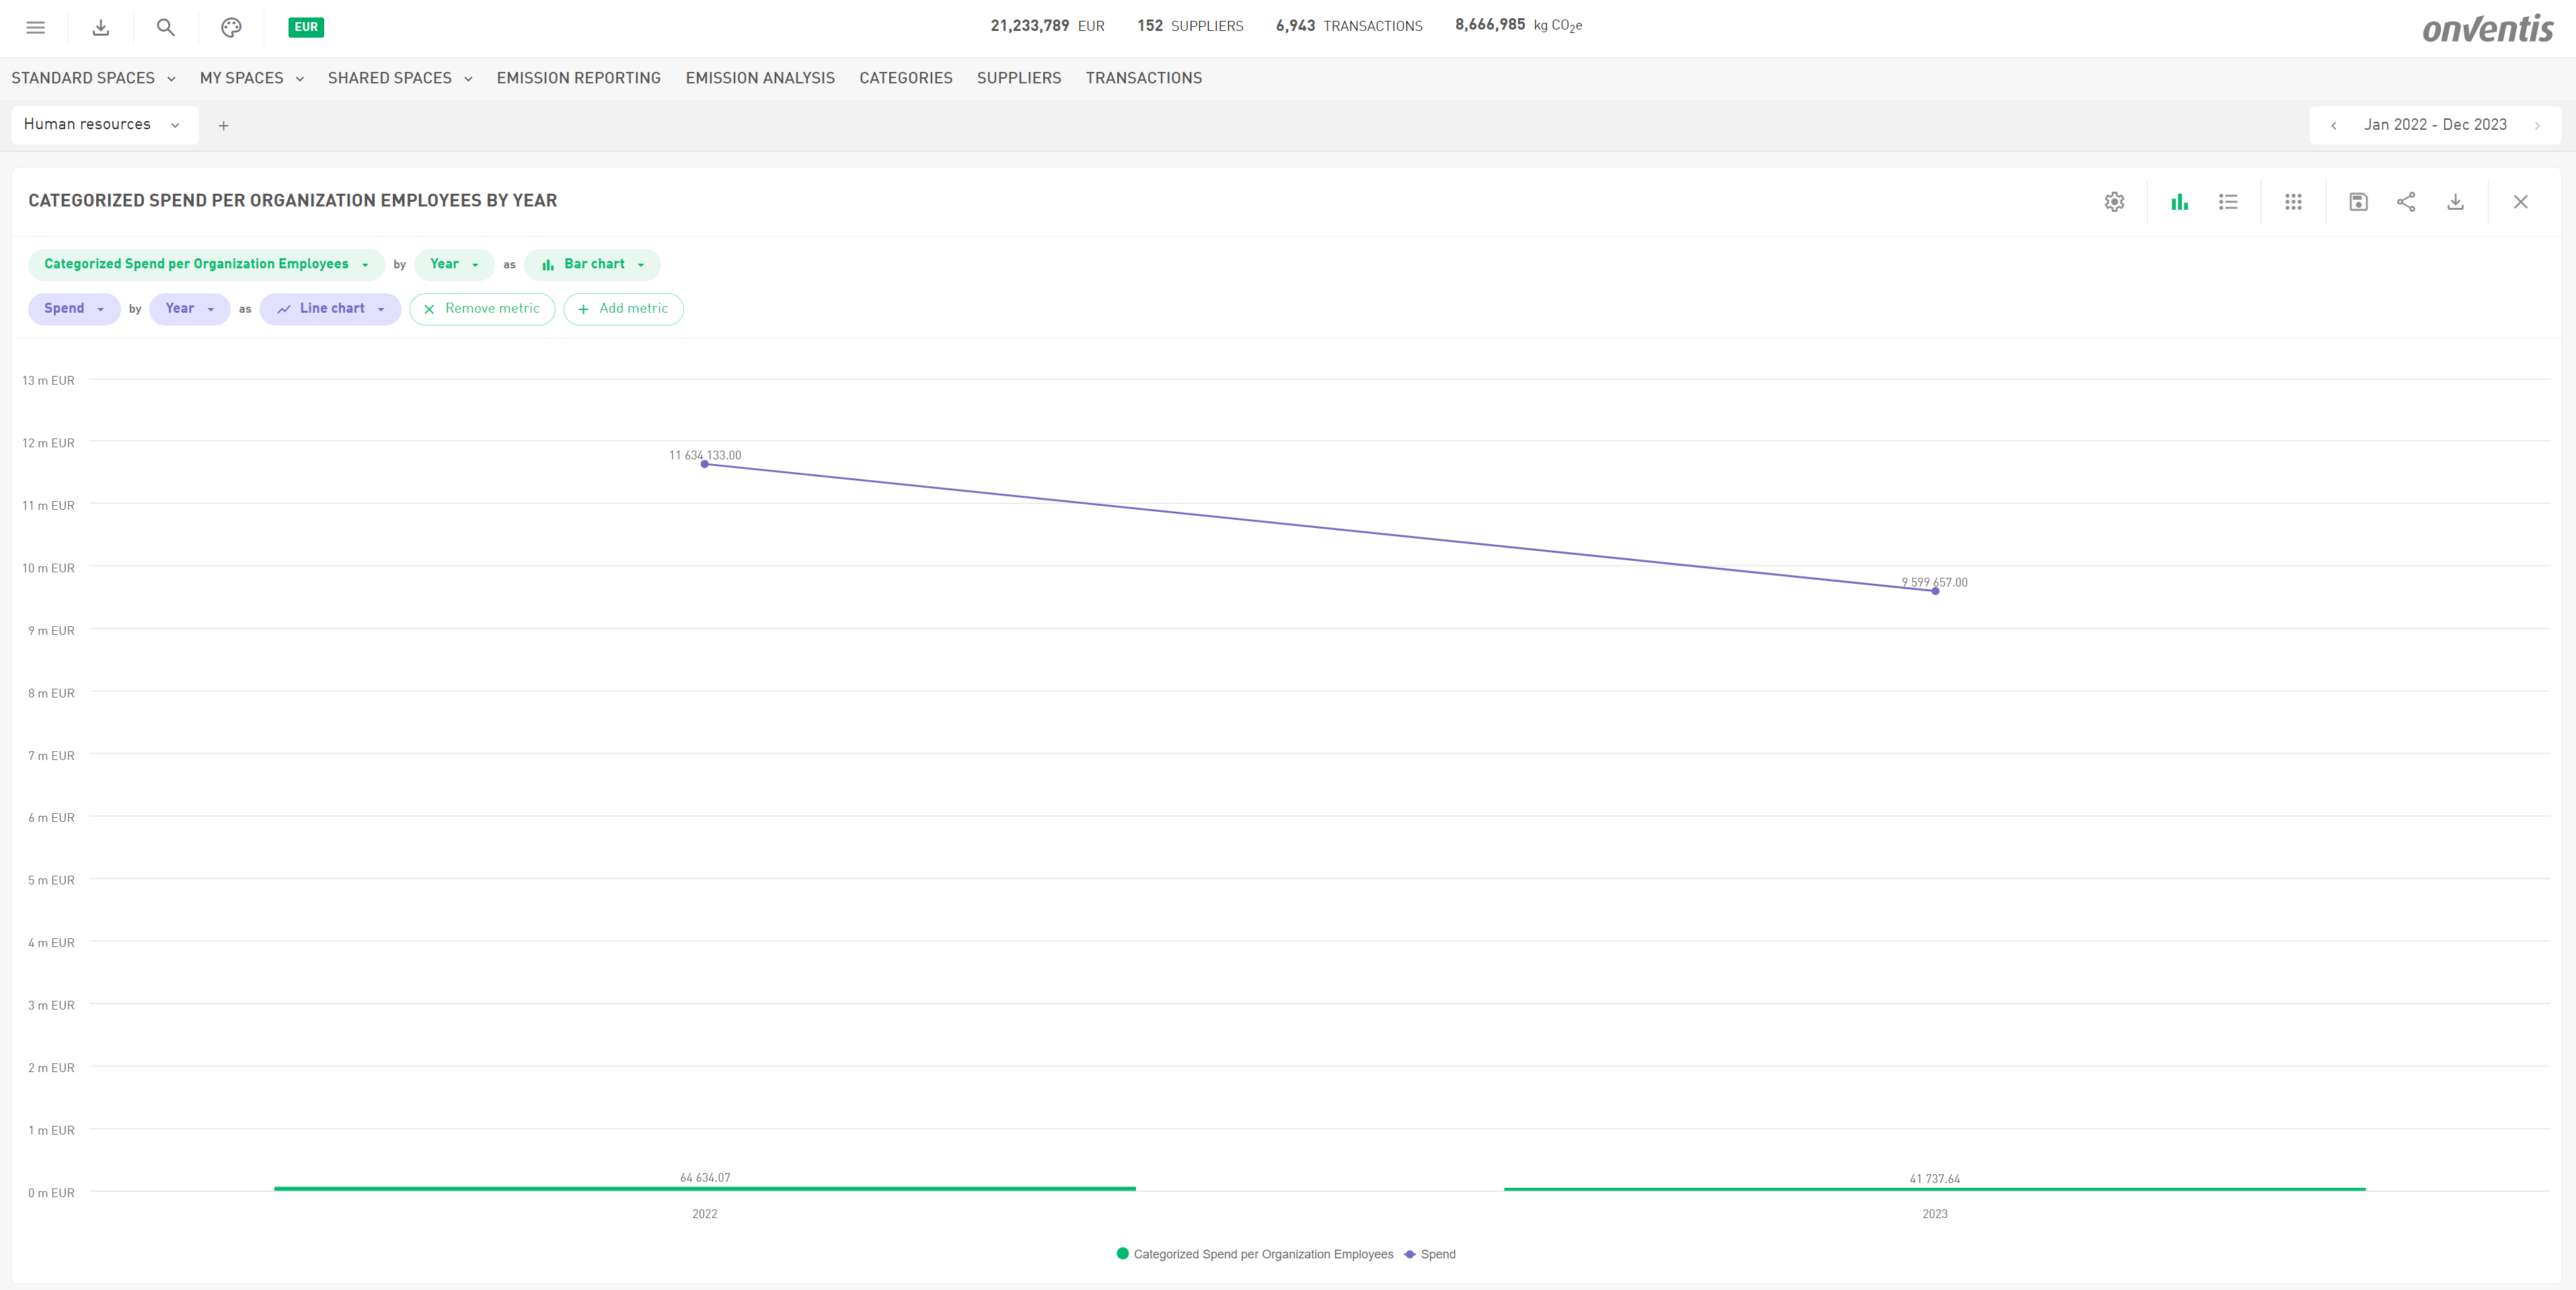
These attributes are pre-configured as Spend Dividers, so once you enter your data, you can instantly analyze KPIs like:
💸 Spend per Employee
🚗 Spend per Company Car
🏢 Spend per Square Meter
Because these values can change over time, you can track how efficiency or cost allocation evolves — without creating new attributes every year.
✅ Why It Matters
Brings structure to company-level data
Enables powerful time-aware spend formulas
Keeps your data model clean and future-proof
Use the Organization entity to connect the dots between your spend and the company context behind it — and unlock deeper insights with less effort.
🍃 EcoSpend: New Emission Factors from Swedish Procurement Agency
We’ve just uploaded the latest Emission Factor file from the Swedish Agency of Public Procurement https://www.upphandlingsmyndigheten.se/om-hallbar-upphandling/miljomassigt-hallbar-upphandling/miljospendanalys---berakna-inkopens-klimatpaverkan/berakna-och-analysera-inkopens-klimatpaverkan-med-miljospendanalys/
https://www.upphandlingsmyndigheten.se/om-hallbar-upphandling/miljomassigt-hallbar-upphandling/miljospendanalys---berakna-inkopens-klimatpaverkan/berakna-och-analysera-inkopens-klimatpaverkan-med-miljospendanalys/, valid from 2022. No action needed on your side — all spend data from 2022 onwards will automatically reflect the newest, most accurate emission factors.
What’s in it for you?
Sharper Carbon Footprint Analysis: Get the most precise emissions data to better understand your environmental impact.
Smarter Sustainability Decisions: Use up-to-date factors to set realistic targets and track progress confidently.
Stronger Supplier Engagement: Leverage fresh insights to collaborate on emission reduction efforts with your suppliers.
Reliable Reporting: Impress stakeholders with climate data that’s continuously updated and refined
Take advantage of this update to power your green goals and drive meaningful change!
New in Analyze 📊
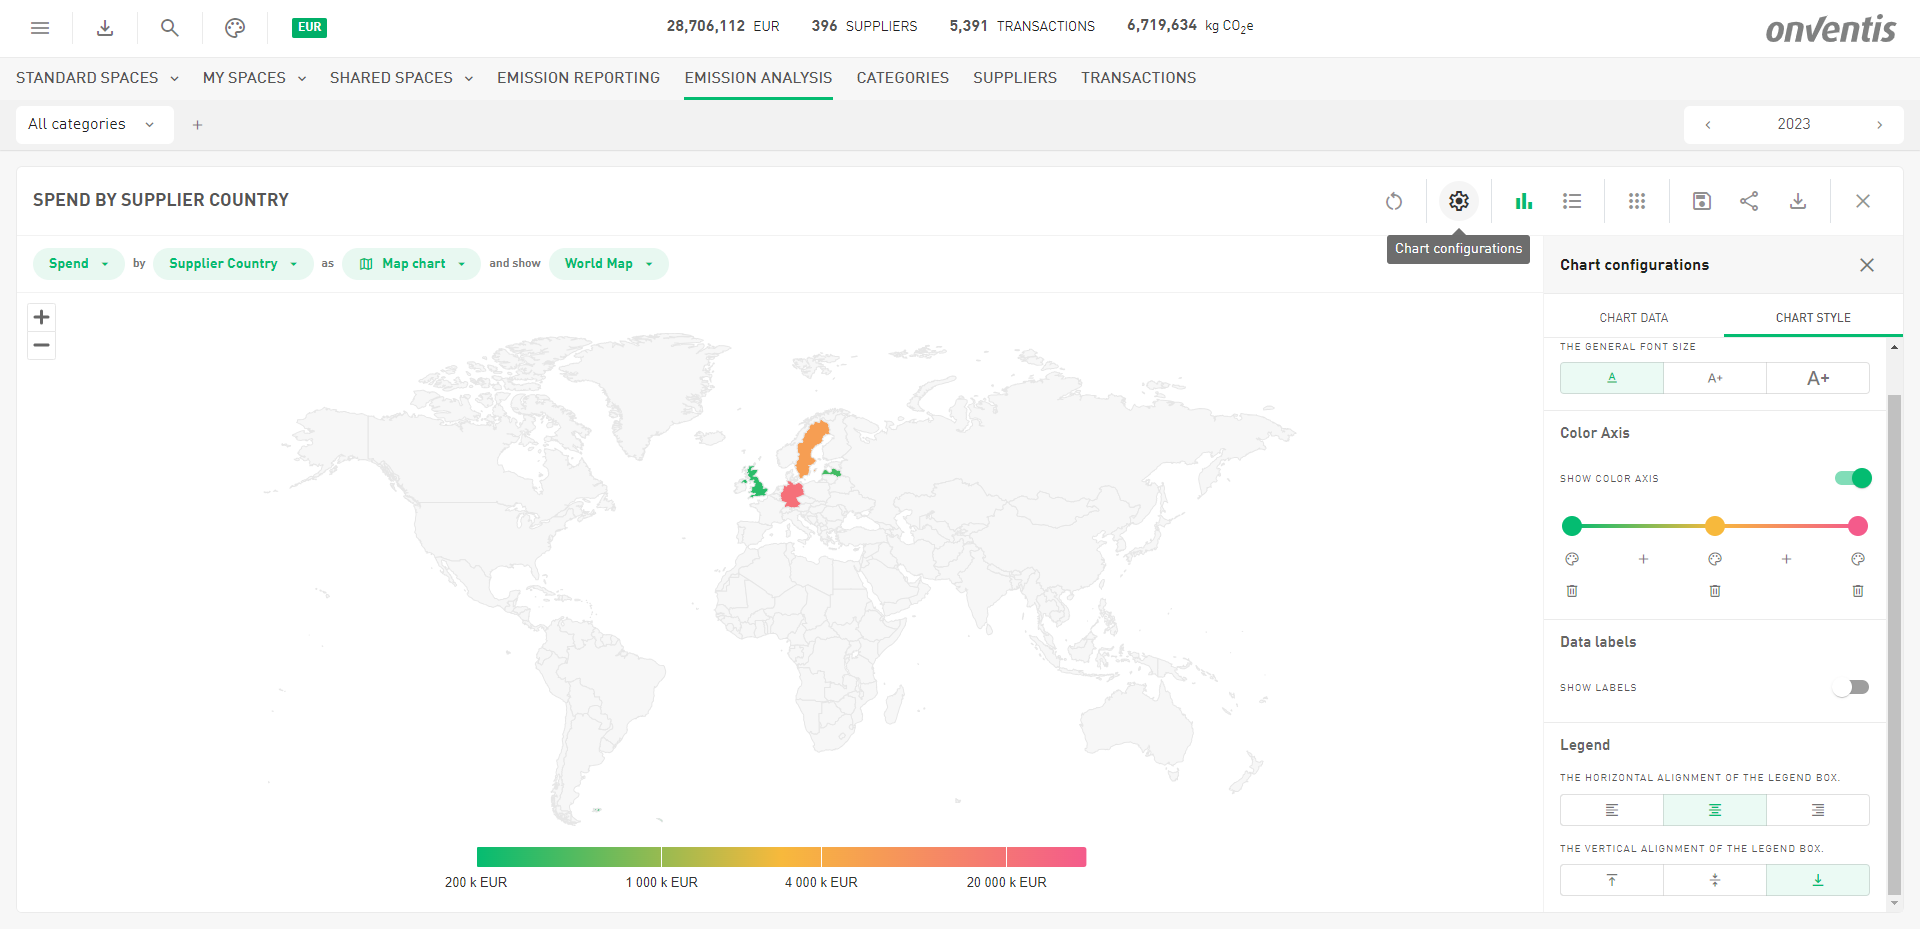
🎨 Map Chart: Now Even Smarter (and More Colorful)
Last time, we introduced our game-changing Map Chart—an intuitive, visual way to explore your spend, emissions, or transactions across supplier or production countries. With just a few clicks, you could zoom from a global overview straight into key regions like Benelux, the Nordics, DACH, or the Baltics. Simple, smart, and stunning.
And now? We’ve taken it up a notch.
🌍 Map Chart as Your Go-To:
Whenever you select Supplier Country or Supplier Production Country, the map chart now comes as your default view—no need to switch manually. It’s all about getting you to insights faster.
🖌️ New Color Gradient Magic:
We’ve added dynamic color scales to the map—so you can instantly see where your impact is highest or lowest. Green marks the lower end (like low spend or emissions), while red indicates the hotspots.
Prefer a different palette? Go wild. You can fully customize the gradient and add as many colors as you like. Want blue-to-purple? Teal-to-orange? It’s all in your hands.
Get ready to turn data into geography-driven insight—one beautifully colored map at a time.
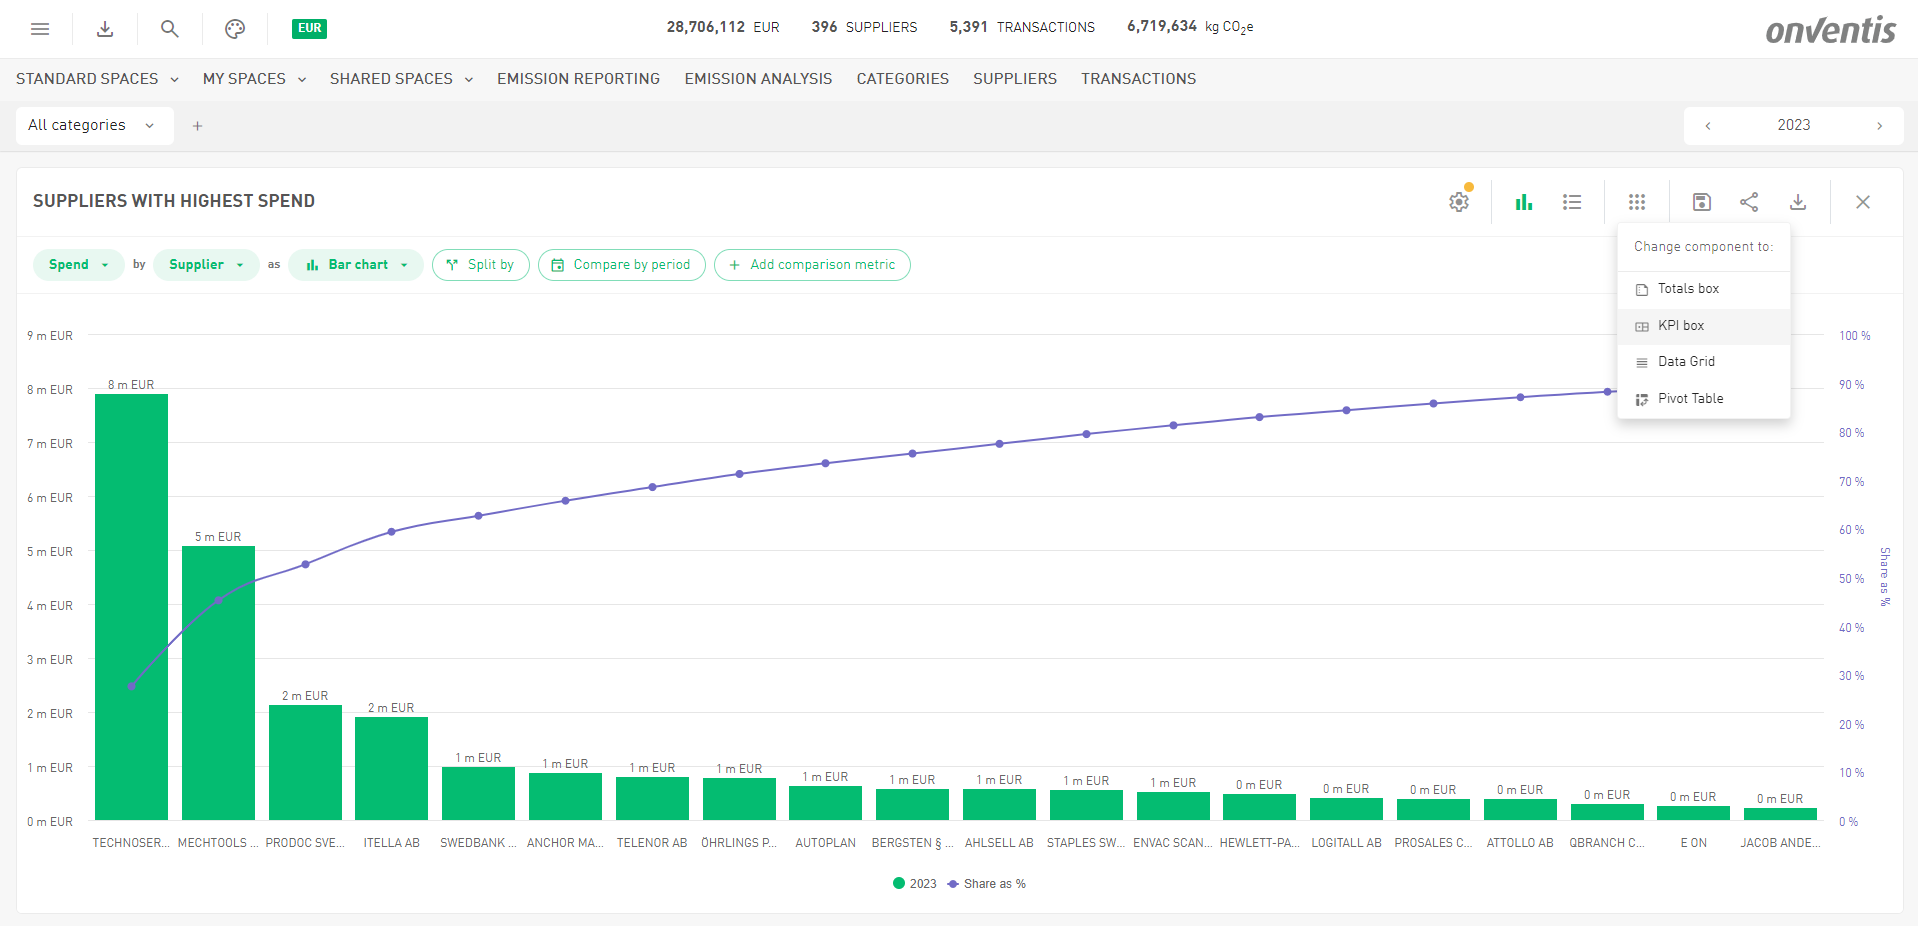
📦 Meet the New KPI Box – Small Box, Big Insights
Think of it as the totals box's cooler cousin: our brand-new KPI Box component brings your key metrics front and center—with a cleaner design and more visual punch. Whether it’s total spend, emissions, savings, or transaction volume, this component puts the numbers that matter most right where you need them—at a glance.
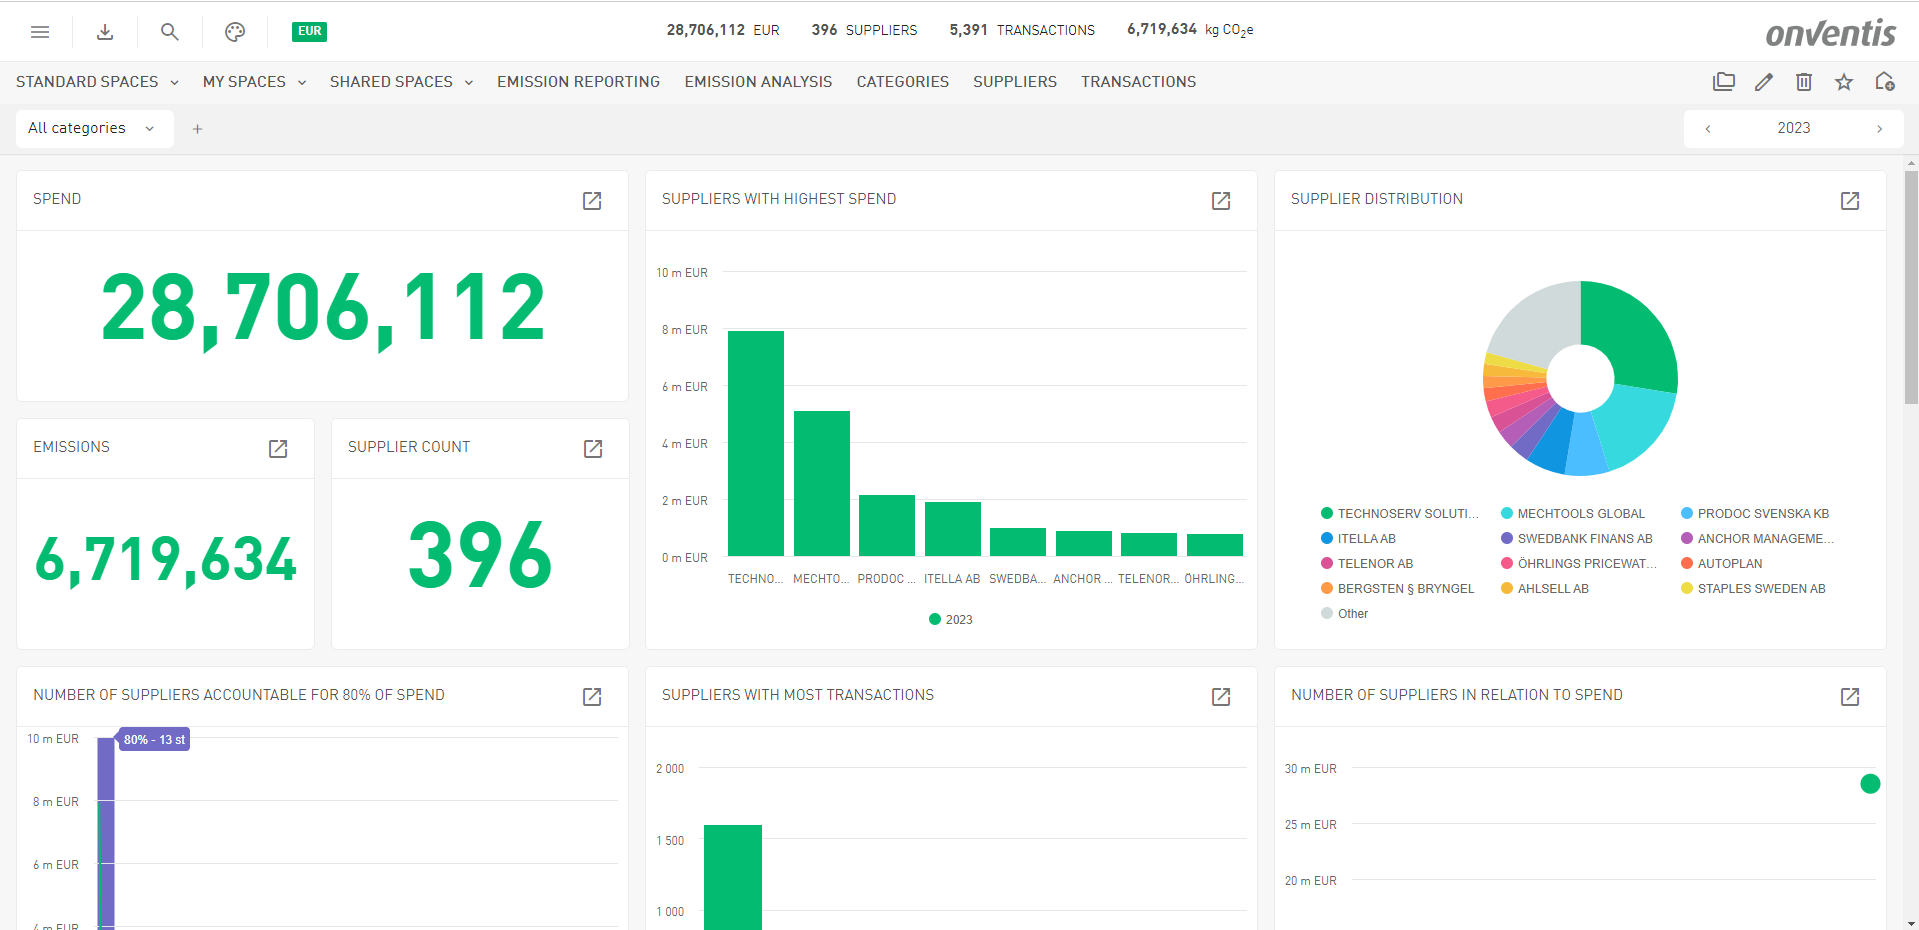
📊 Customize Your Dashboard Like Never Before
We’ve also upgraded our grid layout to be as flexible as your data stories. You can now add up to 6 charts in a single row, and adjust their sizes freely—go big for that detailed time series or keep it compact for supporting KPIs. It's your dashboard, your rules.
👀 At-a-Glance Clarity Meets Full Context
Use KPI Boxes alongside your charts to create a clean, cohesive view of performance metrics and trends. Pair a KPI Box with a Map Chart for a powerful one-two punch: see the total and where it’s coming from—all in one place.
Build dashboards that do more than look good—they work smarter.
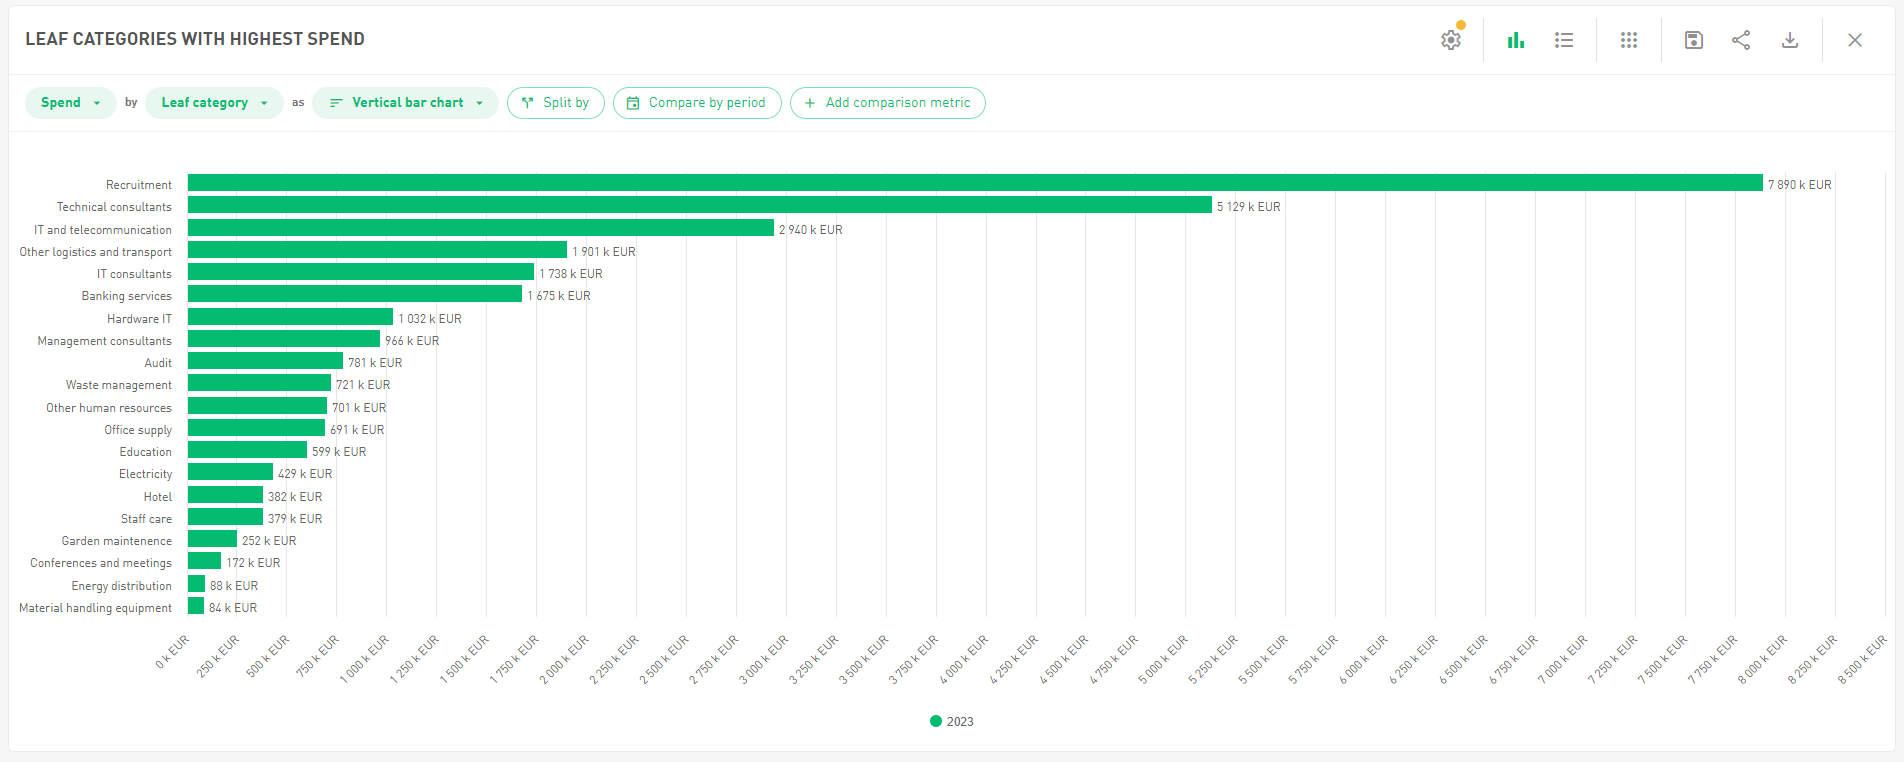
🧩 Smarter Split & Comparison Options – Now More Intuitive Than Ever
We’ve made it easier (and cleaner) to define how you break down and compare your data. Here's what’s new:
🔀 Split Only When You Need It
No more clutter! The “Split by” option now appears only if you want to use it—keeping your view clean and focused when you're working with simpler charts.
📅 Compare Period & Metric – Right Where You Need Them
We’ve moved the “Compare by period” and “Add comparison metric” buttons closer to your main chart setup (right next to metric and group-by selections). That means fewer clicks, more clarity, and a faster path to insights.
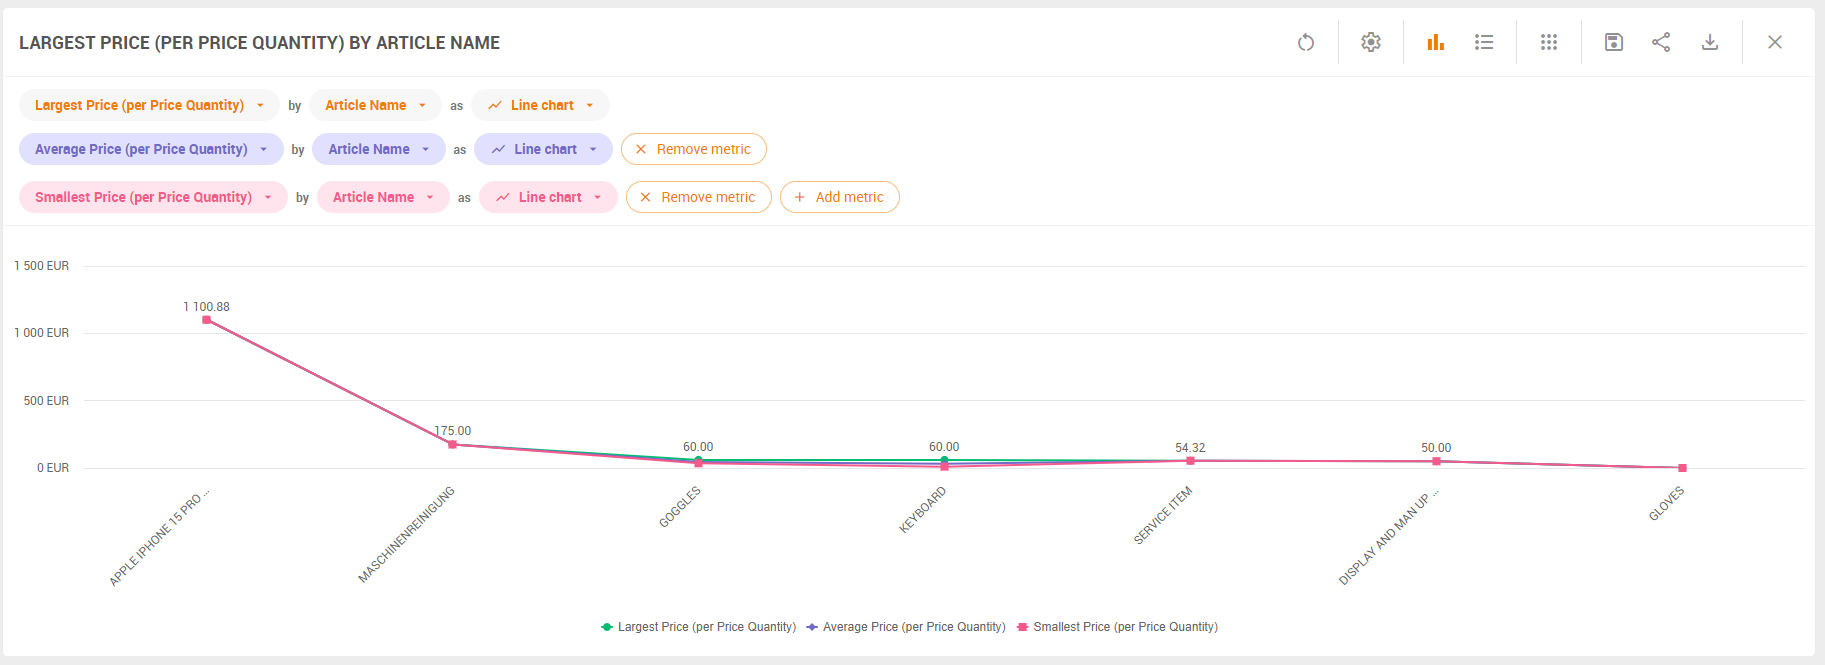
📊 Up to Four Metrics, Side by Side
Why stop at one when you can compare four? You can now analyze up to four metrics at once—perfect for more nuanced insights. For example, when analyzing price comparisons, you can view the largest, average, and smallest price per article all in a single chart. This makes it easier than ever to spot anomalies, track price trends, or validate savings potential.
The result? More context, better decisions, and a faster route to data-driven actions.
🧭 New in Supplier Management: Dashboards & 360° Supplier Views
We’re bringing analytics even closer to where decisions are made—directly into Supplier Management. With this release, we’re excited to introduce two powerful new features designed to give you both the big picture and the detailed view of your supplier base.
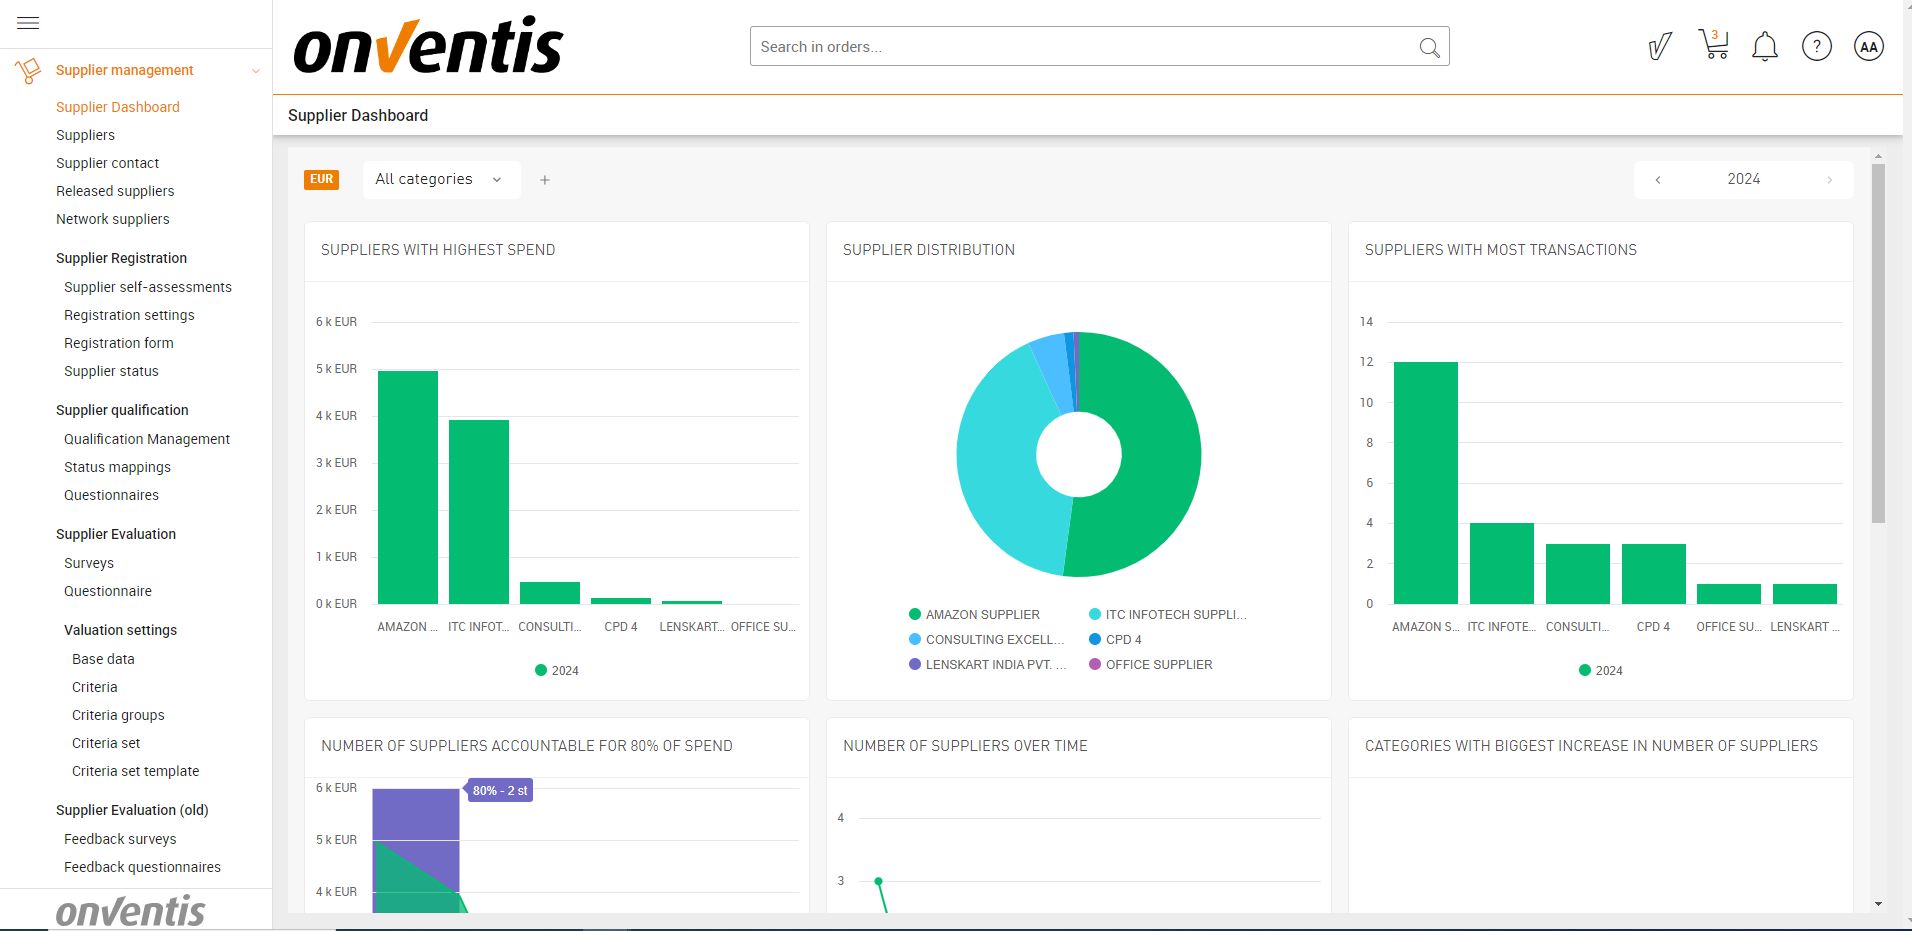
📌 Supplier Dashboard & 360° View
We’ve added two new analytics-driven views directly in the Supplier Management module:
A Supplier Dashboard that gives you quick insights into your entire supplier base
A 360° view to deep-dive into individual supplier KPIs
Both features are available for users with a Spend Analytics connection and the right access permissions.
👉 Learn more about these views and how to access them.
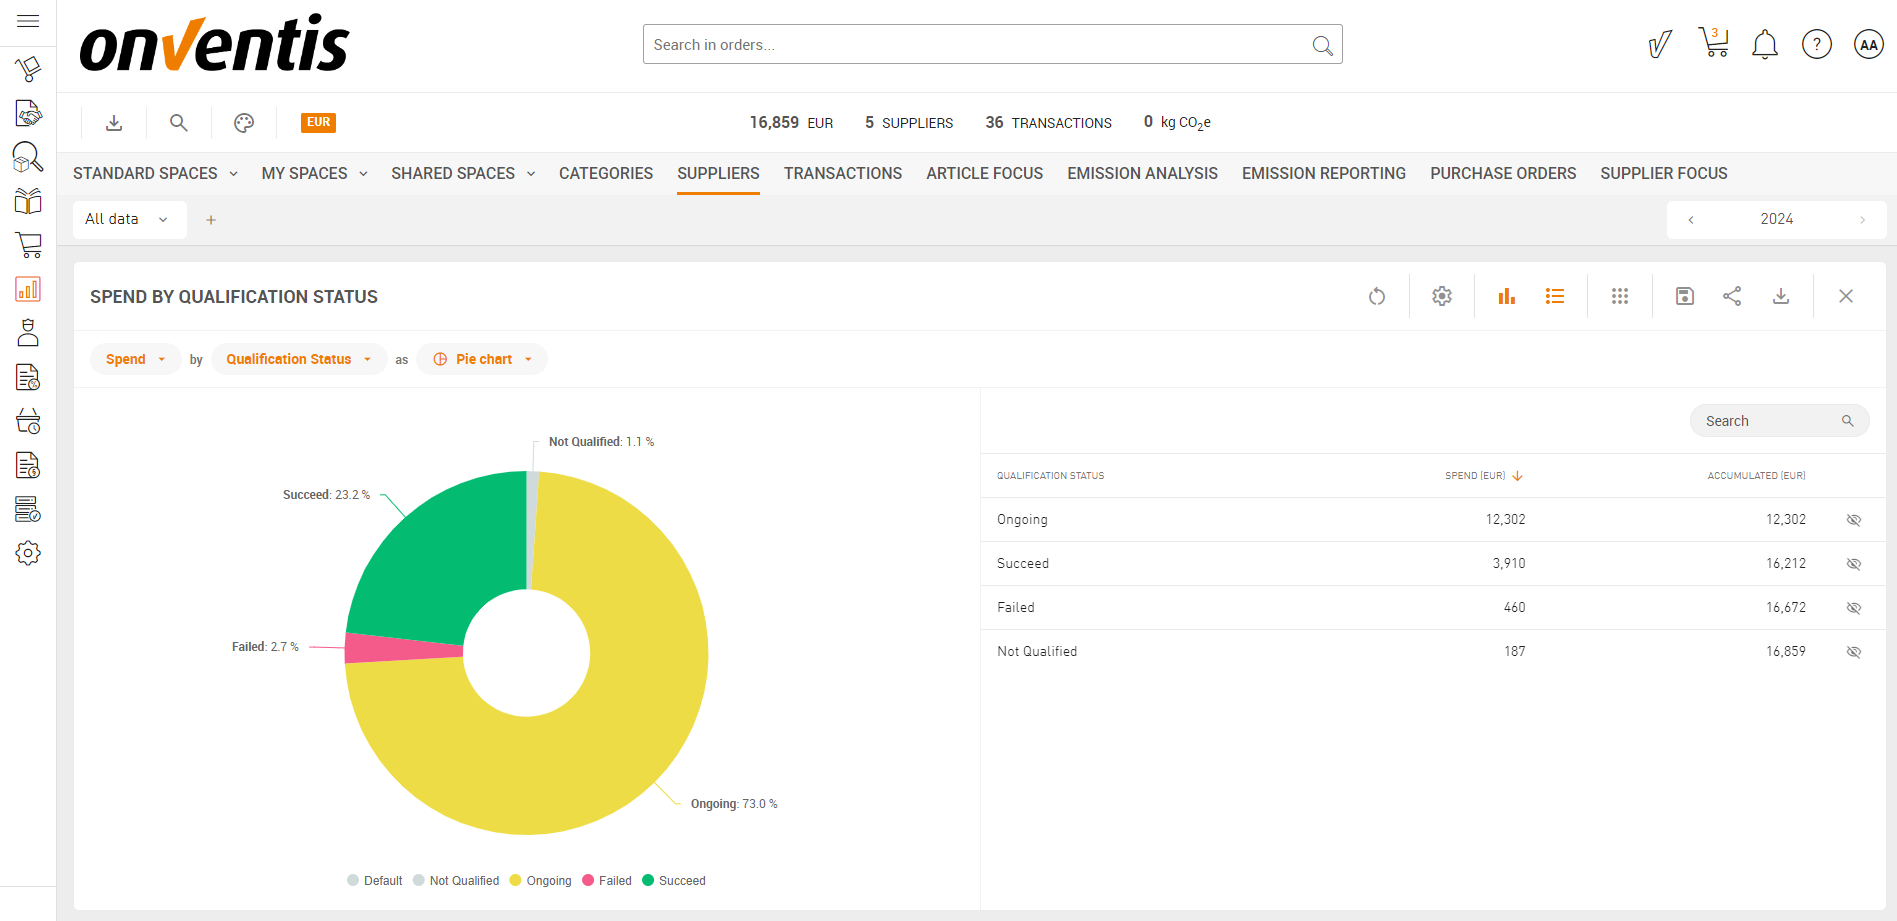
📌 New: Supplier Qualification Status in Analytics
For Onventis Supplier Management users, we’ve expanded our data model to include the Supplier Qualification Status. This opens up new analysis possibilities—like tracking spend by qualification status, to identify risks, or benchmark supplier performance.
Actions you can take on the insights:
Prioritize spend with fully qualified suppliers to ensure compliance and reduce risk.
Identify suppliers with failed or pending qualifications and follow up to avoid disruptions.
Optimize supplier base by analyzing supplier count across qualification statuses and consolidating where appropriate.
Benchmark performance of suppliers based on their qualification status to guide future sourcing decisions.
Monitor risk exposure by tracking spend allocated to suppliers with lower qualification levels.
Plan targeted supplier development or qualification improvement initiatives based on gaps highlighted in your analytics.