Spendency 6.1 & 6.2
Spendency 6.2 brings an unprecedented amount of new capabilities to the analytics section of Spendency. So many new metrics for your graphs – and you can now add as many metrics as you want. And show off you metrics using all new data tables, right in your own spaces.
So Many New Things to Calculate
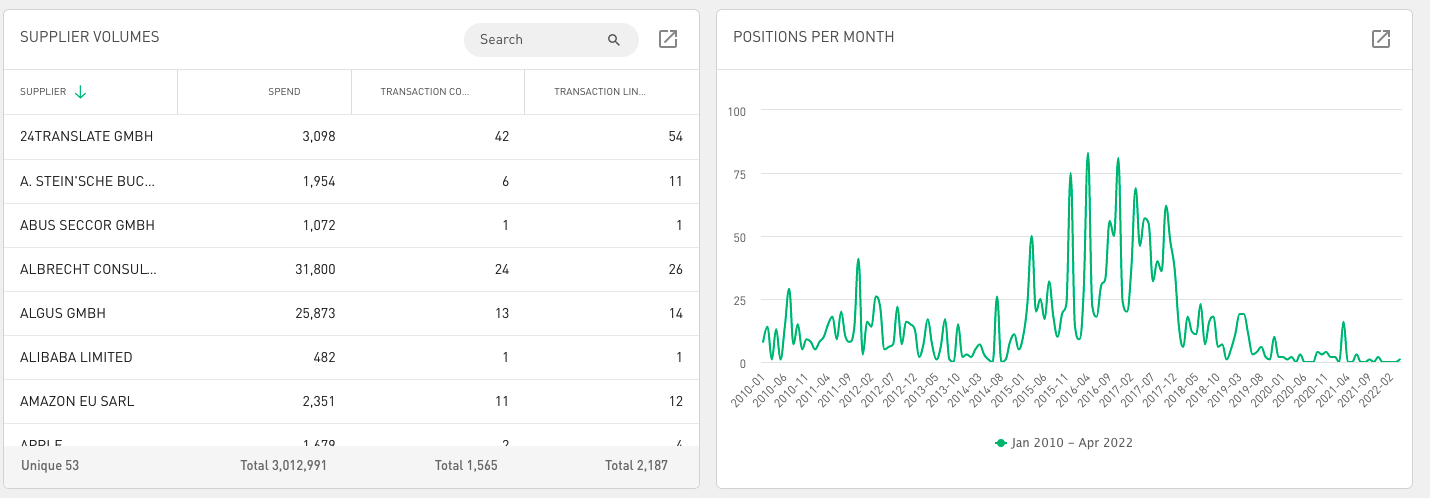
Life is so much more than the sum of the amount you have paid. Now, you can show graphs of any number or money amount that you have uploaded. Yes, that means price average as a trend over time. Or the average number of lines per purchase order. Or the quantity ordered for a product each time you order it.
You can also use your data points, to count how many unique articles you order per supplier.
New Data Types: Numbers, Amounts and Dates
When adding rich data to your spend data, you can now add all kinds of numbers (integers or decimals), amounts (for with currency conversion is automatic, as always) and dates.
With the new metrics engine, you can now use your numbers to calculate averages, maximums and so on to use in your graphs. And you can use any date to display your data over time, to look at the development.
Line Level Analytics
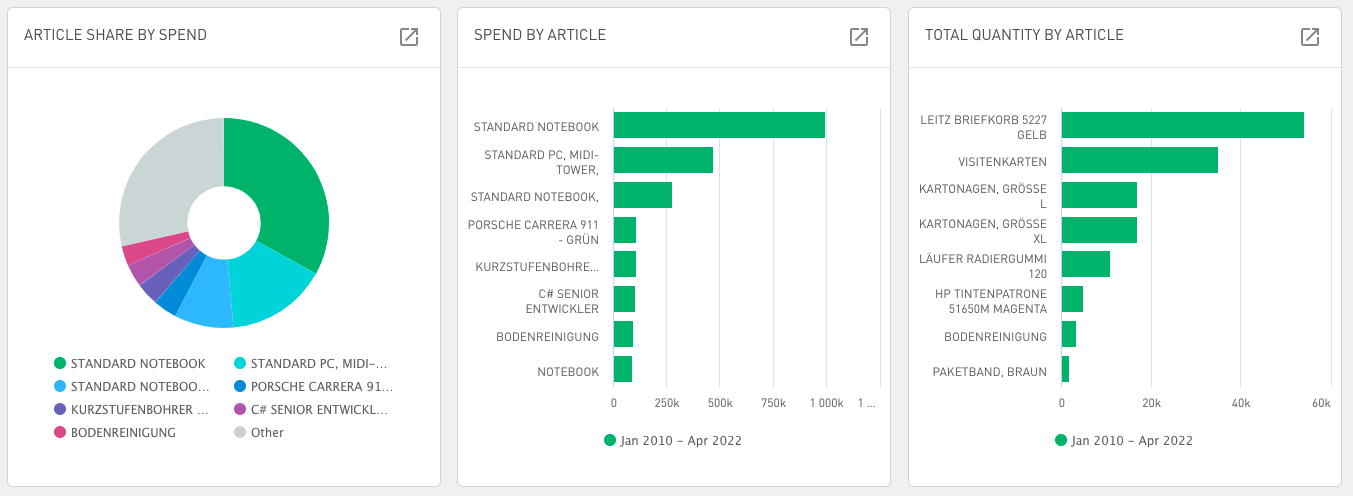
Spendency is very happy to announce that we are now bringing line-level analysis to all customers with the Master Data module. Spendency will come out-of-the-box with the most important data point already included – price, amount, articles and so on. You can now upload all invoice or purchase order lines and analyse trends and behaviours for articles and prices.
Enabling Line Level Analytics
(not needed for Onventis customers)
To analyse line level information, you must first upload line level information. You don’t have to replace old invoice data if you don’t want to – Spendency handles a mix of invoice-level data and line-level data seamlessly. You can even mix line level data from one ERP, and invoice level from another ERP (if you have two). Or, mix data from your procurement system and your ERP.
For the best result, there are some columns you should upload to make the data easier for Spendency to process:
- Transaction ID – you probably already have this, it’s the invoice ID.
- Transaction Line ID – a unique identifier for each line on the invoice. This enables counting invoice lines, even when an invoice line has been split over multiple GL accounts.
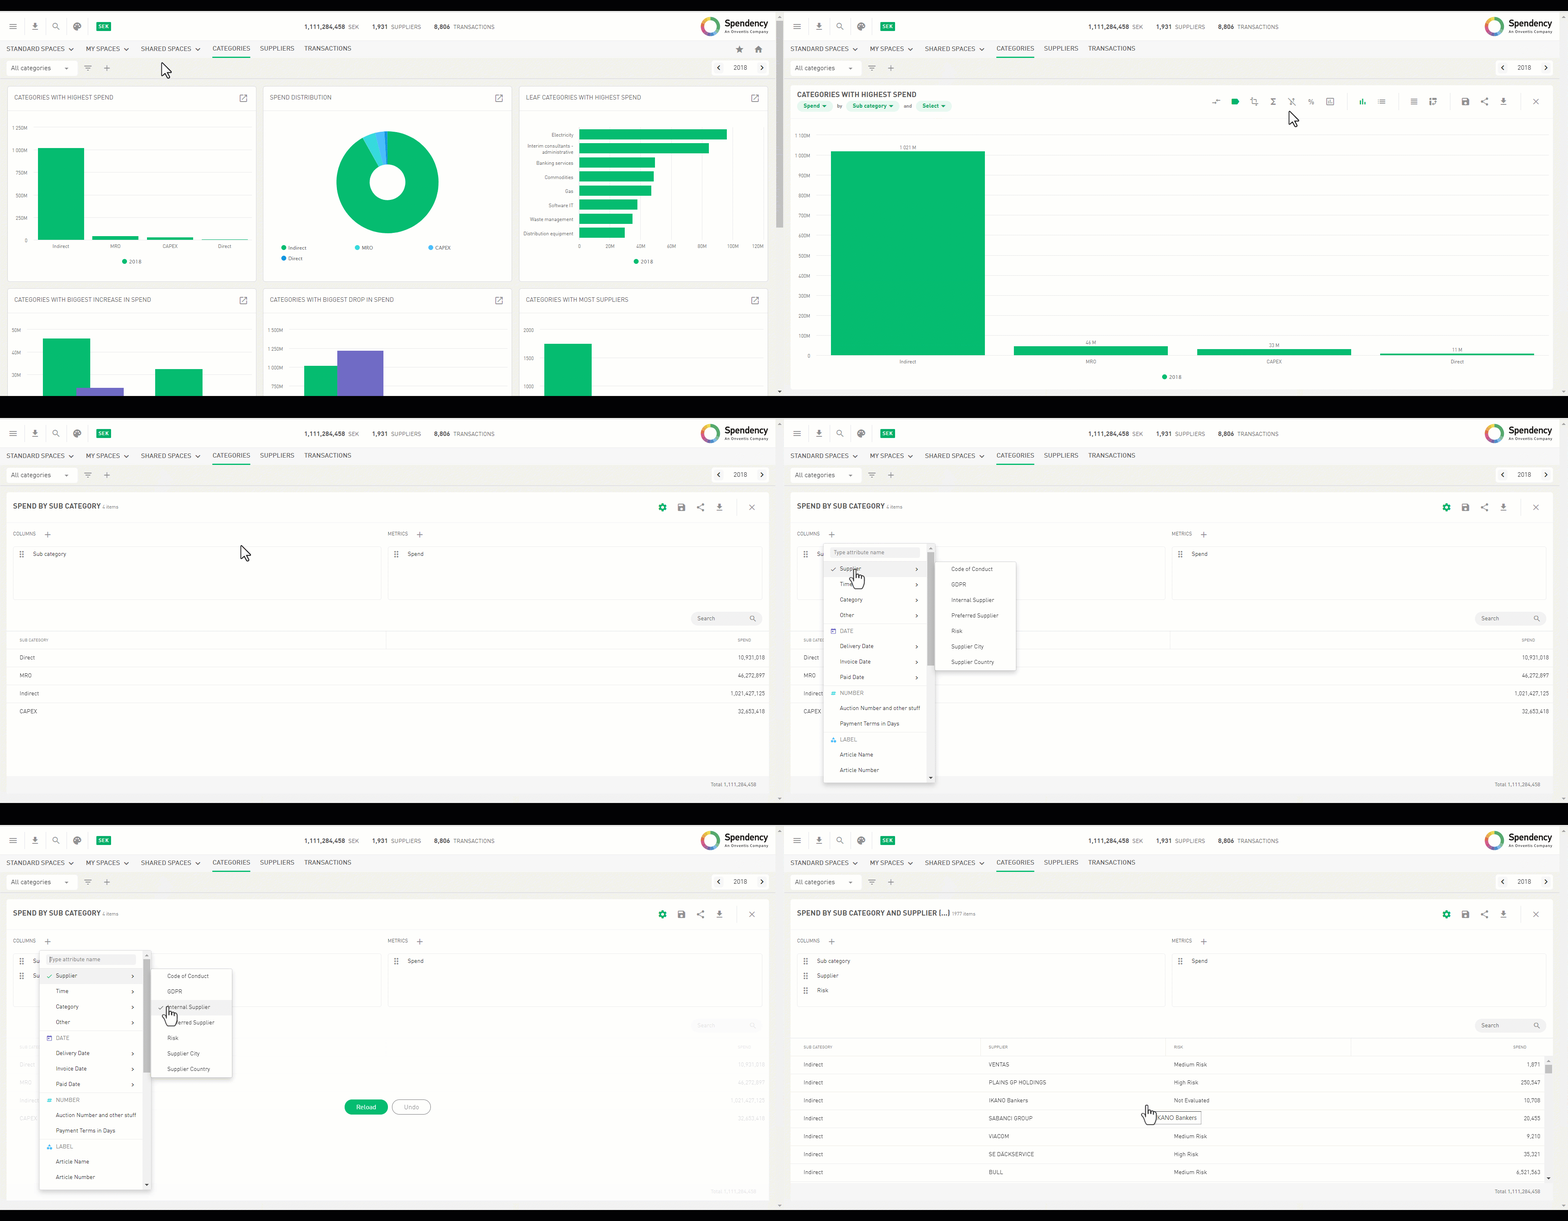
Data Grids
An all new feature in Spendency is configurable table data directly visible in your dashboards. We call them “Data Grids”. You can add as many data points and more importantly as many metrics as you like in one table. Sort order is configurable, and even multiple sort columns can be configured. Together with the new flexible dashboard builder, this takes your dashboards to the next level.
Dashboard Editor
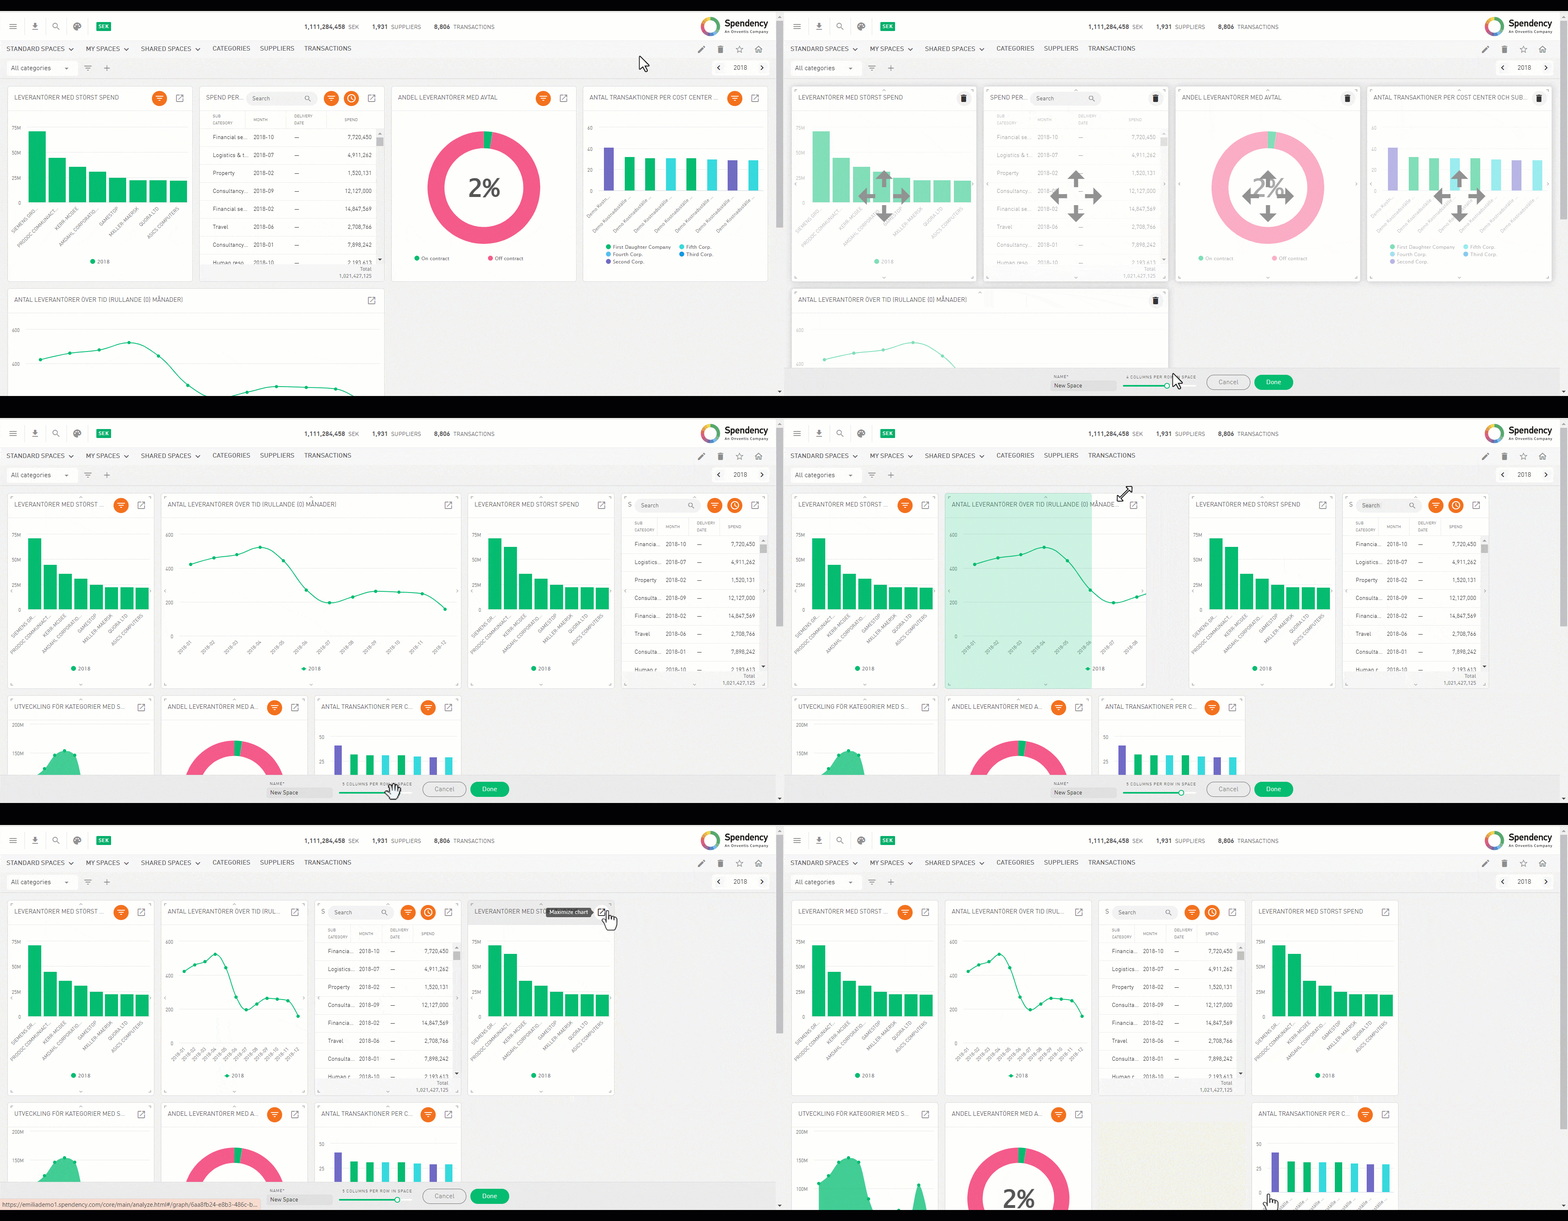
When creating your own spaces, you are no longer confined to a 3 column grid. You can chose 1 to 6 columns as the starting point for your dashboard. And, you can now resize both graphs and data tables to any width and height that you like!
Product Catalogues
With Spendency Master Data, you can now upload entire product catalogues from your most important suppliers and link the catalogue to the spend. This is especially powerful together with line-level analytics. The product catalogue can contain any additional data that you want per product, such as Eco labelling, core assortment labels or agreement information. This enables a whole new view on how well-managed the spend really is.
What is even more powerful, you can now put a category ID, directly on the product.


Product Level Categorization
When you link your invoice lines directly to a product catalogue, you can also directly leverage product level categorization. This is a completely new type of categorization rules and they allow easy and also very detailed categorization for each product by using existing catalogues from your e-procurement system or other sources.
The product level categorization isn’t limited to product catalogues. You can also use this to upload product groups with categorization, or why not UNSPCS code tables with mapping to you own category tree!
Data driven rules
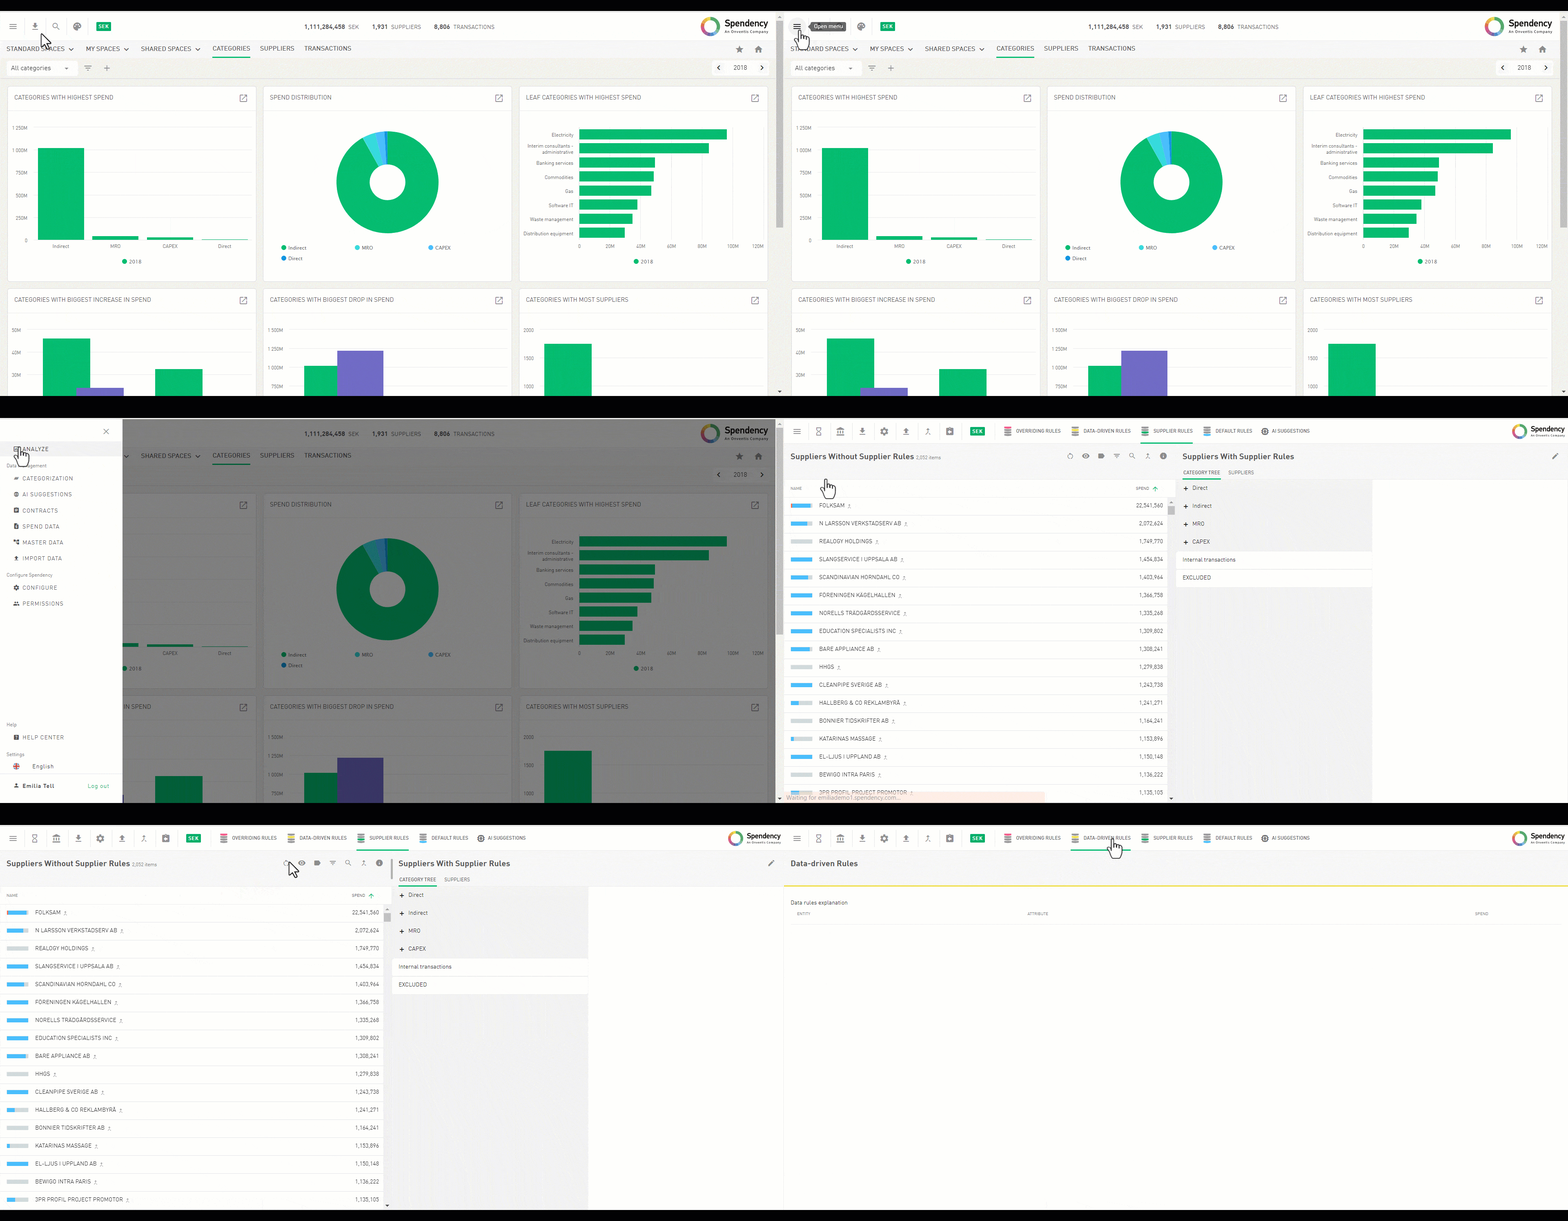
If you have a product catalog, using UNSPCS-codes or having pre-categorization in your spend data on line level, you are now able to categorize your supplier by using the data to make data driven rules in Spendency. Quick and easy!
A new shortcut in charts
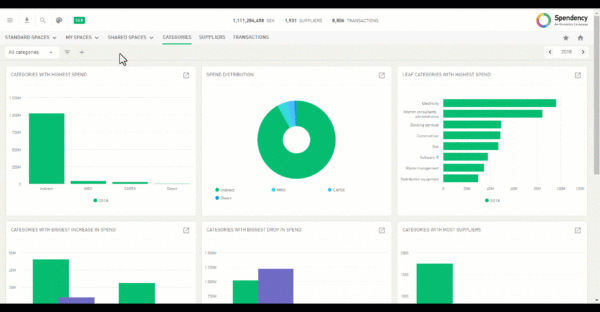
We have made it possible and faster to reach the information card direct from the chart with just one click. Click on one of the bar in the chart and a new small window will pop up.

Drill down in a chart by pressing the header
To enable the feature above we have now moved where you press to drill down to the header.

AI for categorization and normalization
(only for customers who has Master Data)
For our Swedish friends we have now launch our incredible AI for categorization and normalization. Let Spendency do the first hard work and you the fun part! Our international friends unfortunately have to wait just a little bit longer for the AI. But don’t worry, we’re working hard to have it in launch before Q1 2023 is over.

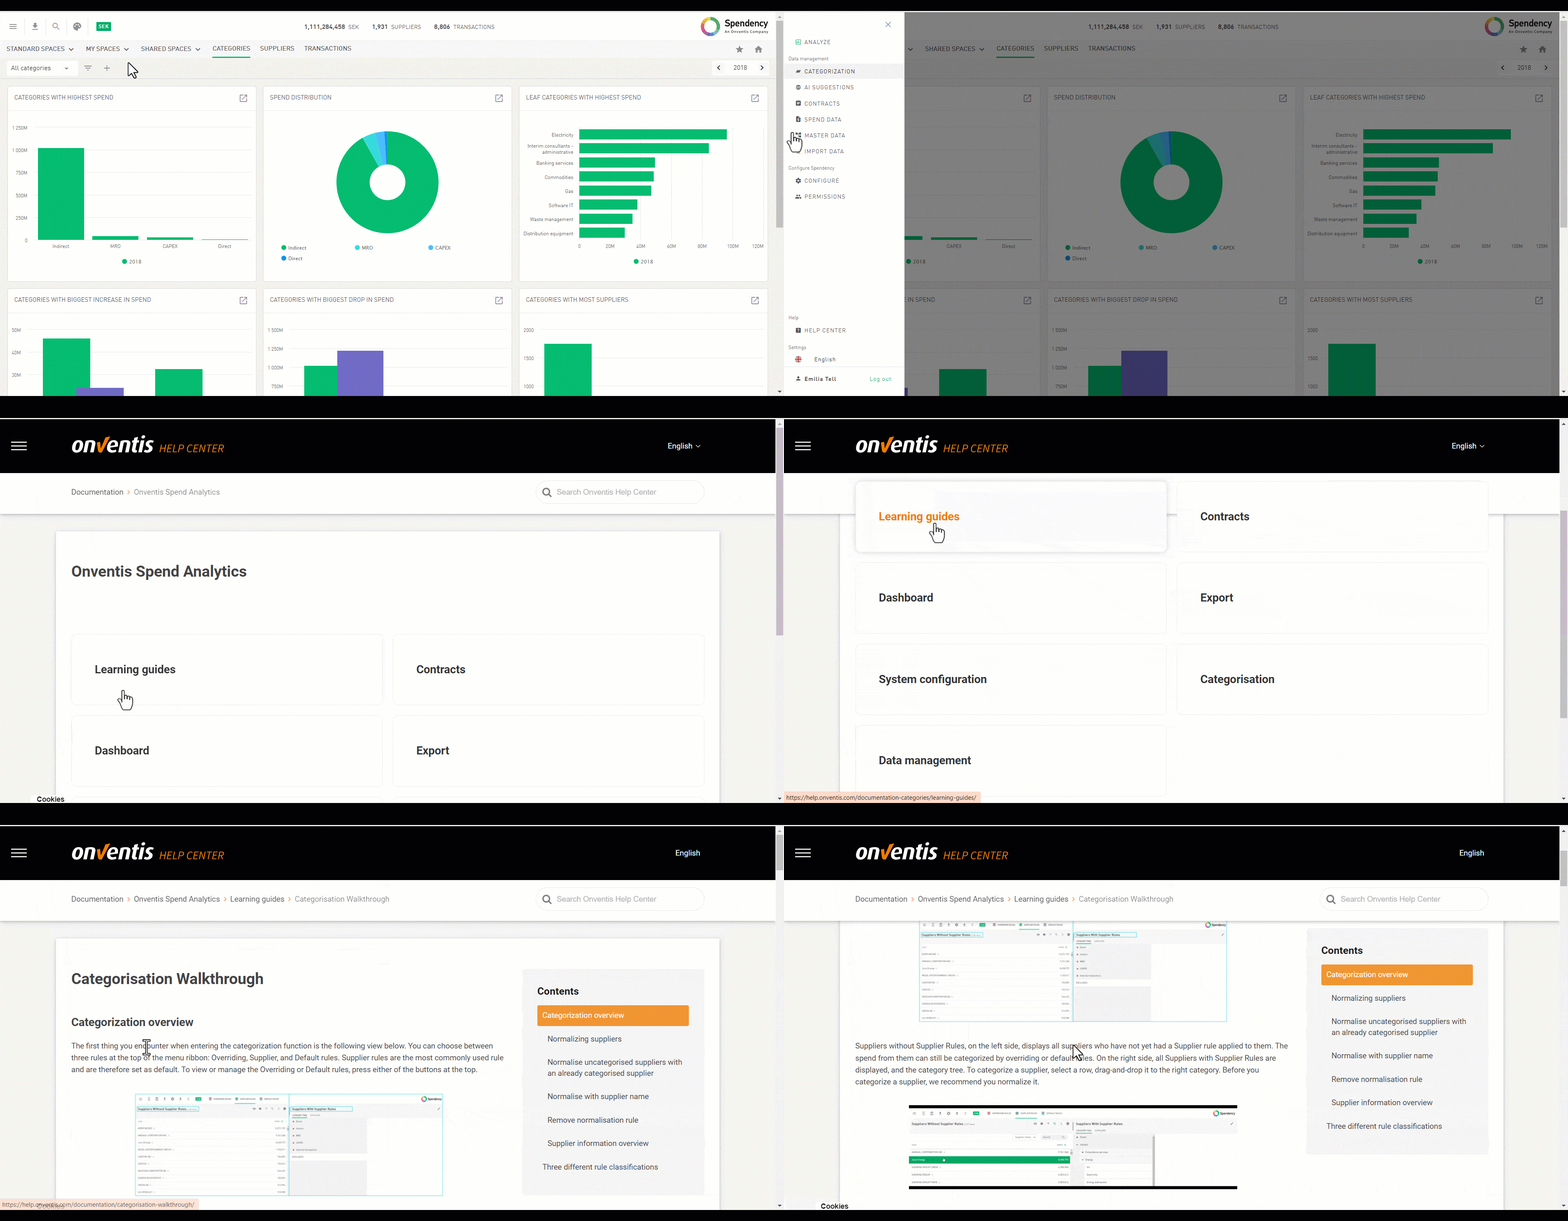
Help center
To get more information regarding parts of Spendency, this is the place to be. We will fill this site with more information, tutorials, best praxis and much more.
