Onventis Analytics 2024.1
Analyze Spend by Agreement
Please note: This functionality currently only works for Onventis Analytics only customers but will also be available for customers using the Onventis Buyer data model in one of the next releases. You will be informed via the release notes.
We are pleased to introduce a great enhancement to our platform, empowering you with the capability to conduct a meticulous analysis of your spend by agreement. Beyond the essential feature of filtering for contract compliance, distinguishing between on-contract and off-contract spending, you are now able to specifically filter for individual agreements to check how much was spend on a particular agreement.
Why does this matter?
Analyzing your spend by contract not only enhances the precision of your financial insights but also serves as a proactive measure to prevent overspending on a contract. Further, it enables accurate budgeting, efficient resource allocation, and cost control. By evaluating your contracts and identifying areas of excessive spending, organizations can optimize their financial strategies, mitigate risks, and negotiate better terms with suppliers. Elevate your analysis and decision-making processes with this powerful new feature, designed to deliver an exceptional level of precision and detail in managing your agreements.
What else has changed?
In the course of offering this new capability we have also changed a few more things.
Contracts
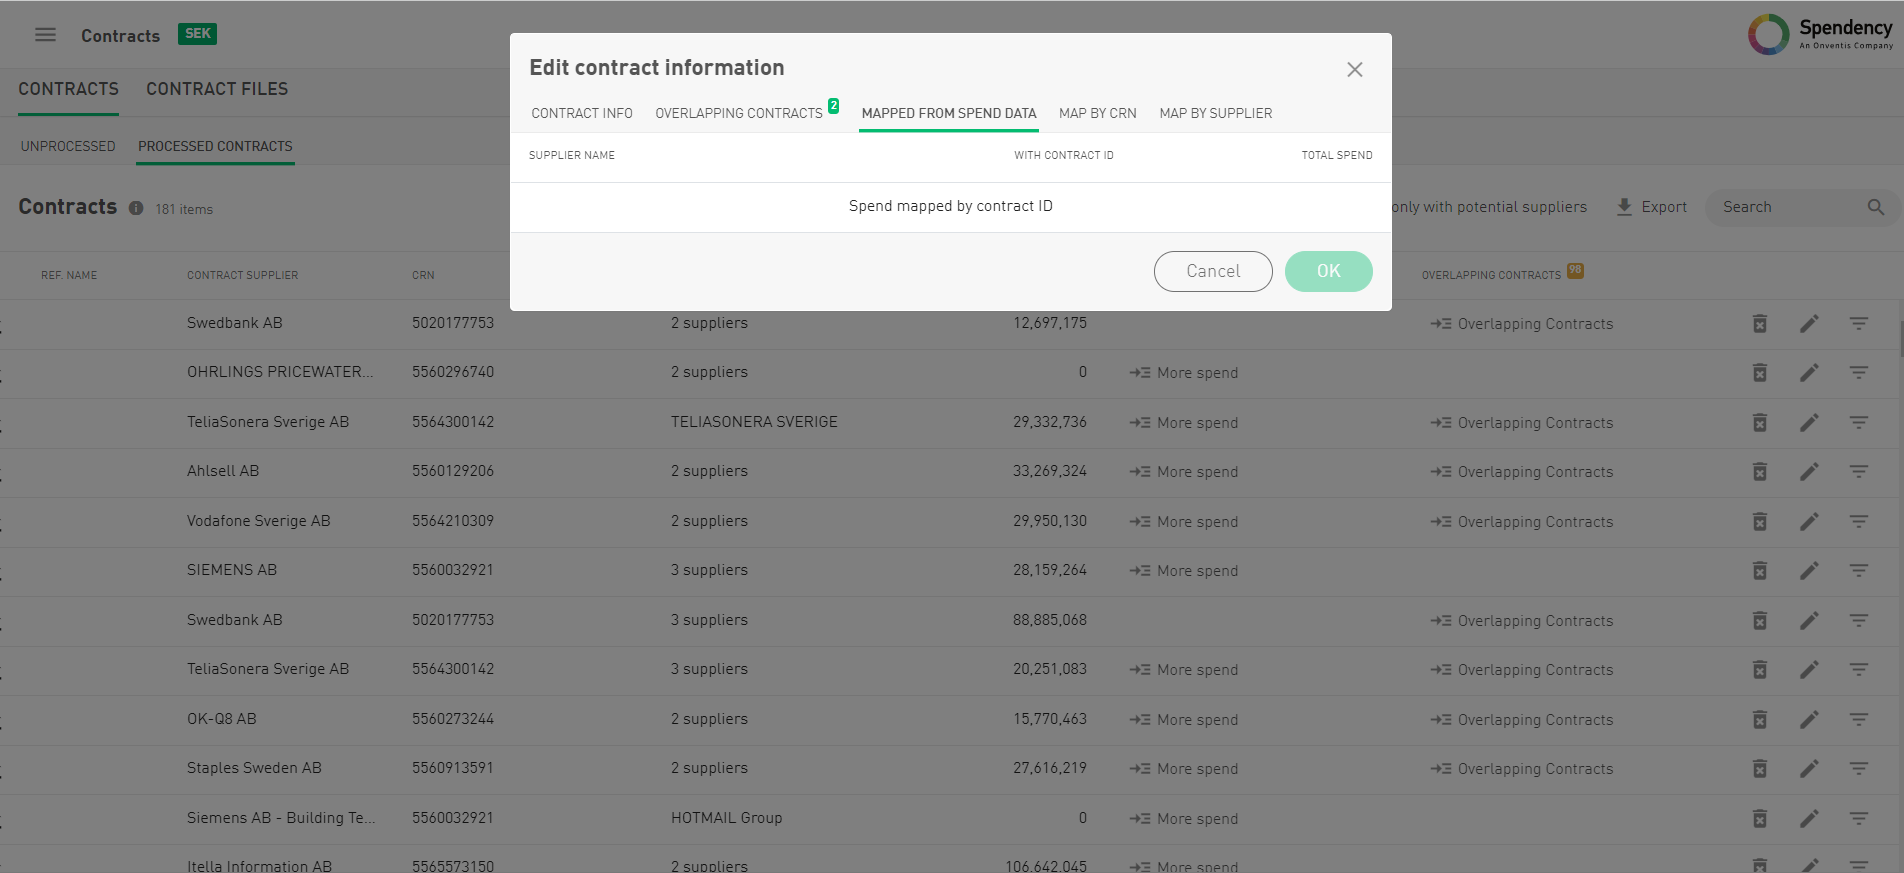
We changed the panel, that opens when you edit a contract. Besides creating own tabs for the contracts that are “Mapped by CRN” and “Mapped by Supplier”, we added another tab that holds the contracts, that were “Mapped by Spend Data”. This new tab holds information of spend for this particular contract, based on the contract ID that was provided in a spend file.
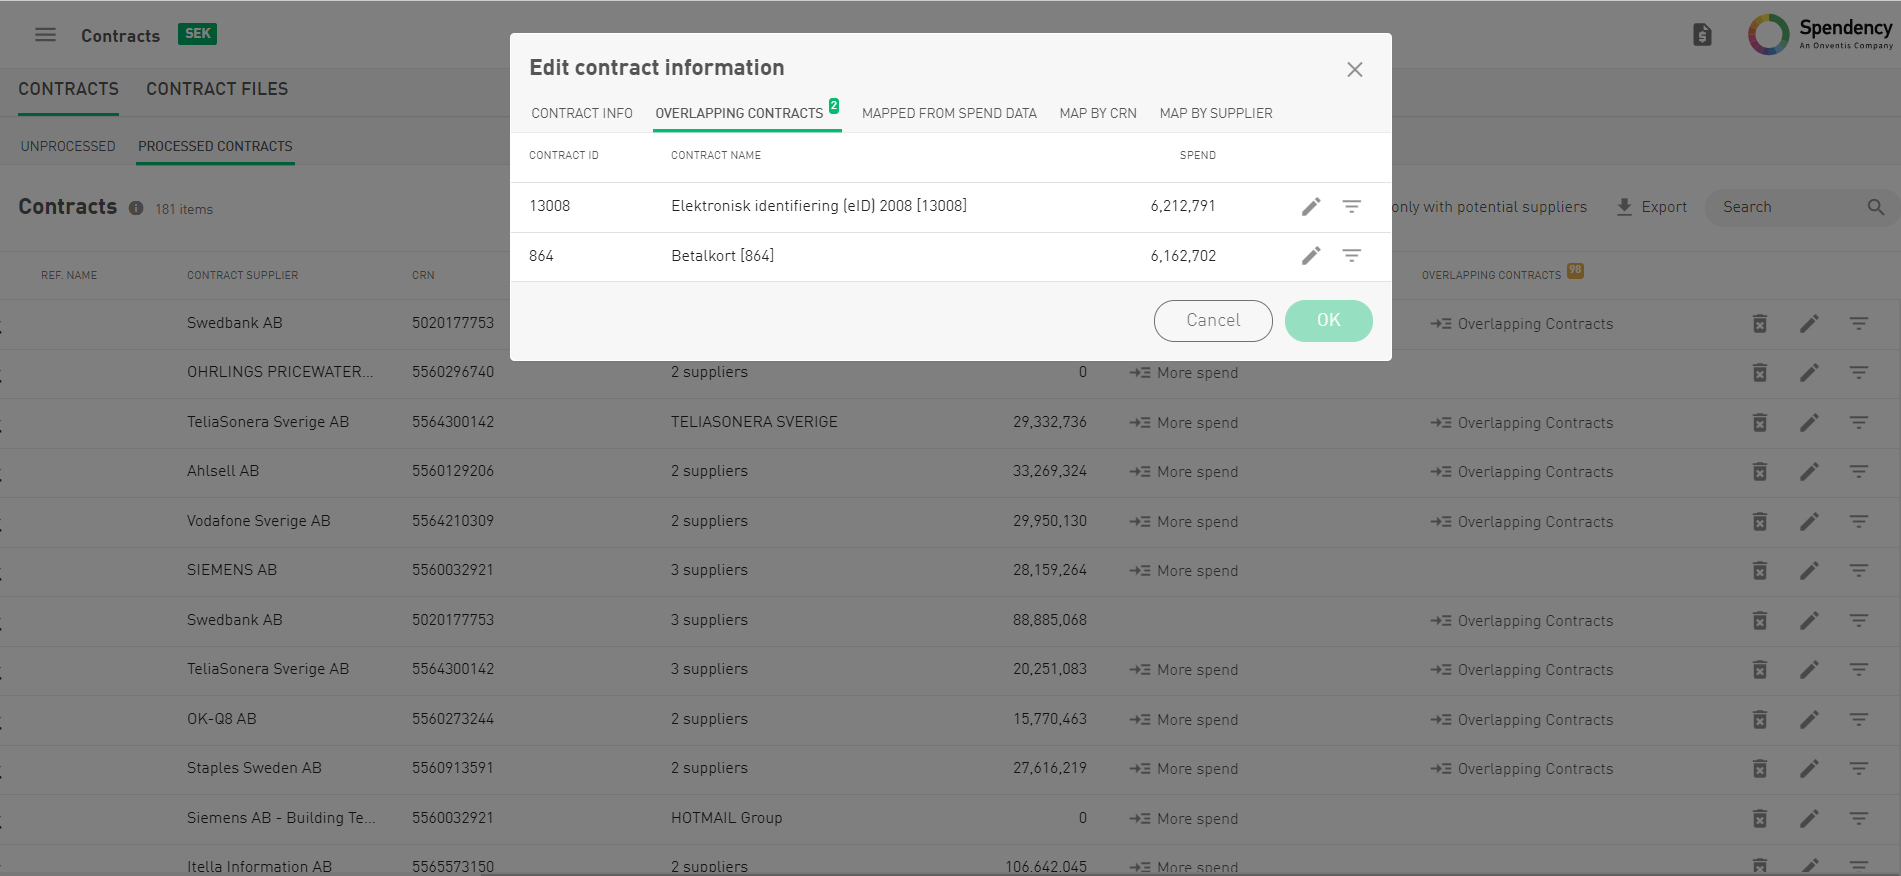
Our new capability of analyzing spend by contract requires to have proper contract data. Therefore we have added another tab to the contract panel to point out where you should review your agreements, as there are overlaps between them. In this tab you will find all agreements that overlap with the one you are currently looking at. If you want to fix your overlapping contracts, simply click on the “limit scope” button to adjust the scope of a contract, so it does not overlap the scope of the other contract anymore.
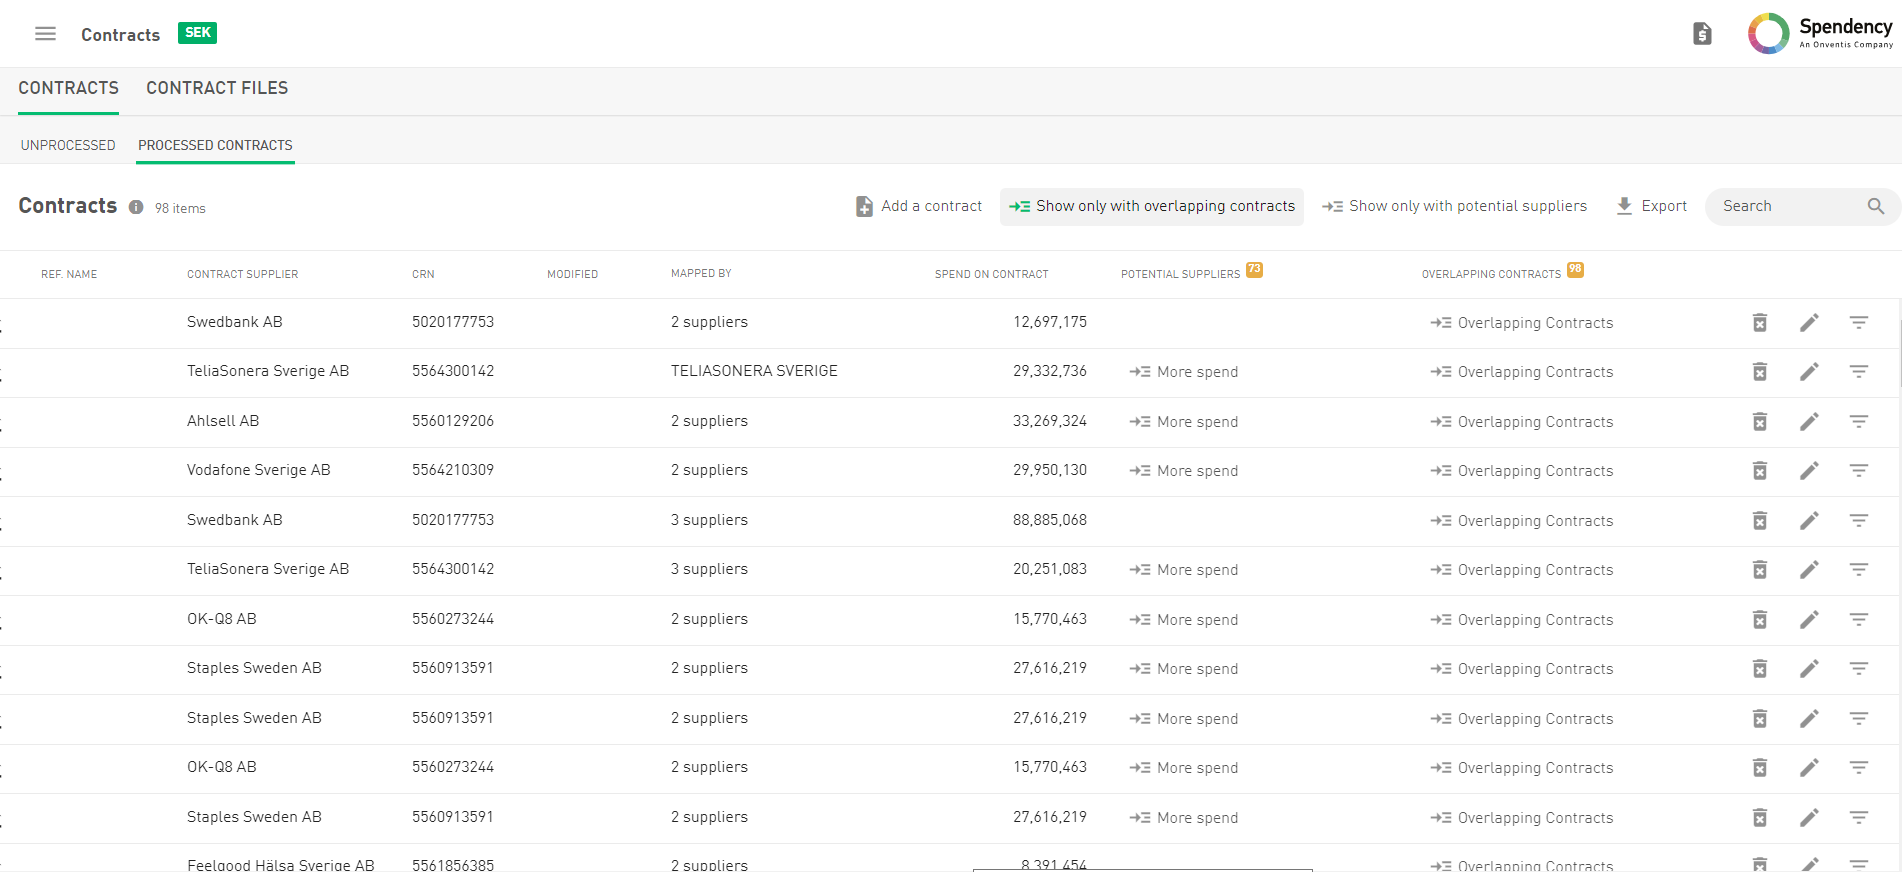
Further, you are able to conveniently filter all contracts that overlapt with other contracts with just one click on “Show only with overlapping contracts”.
Analyze
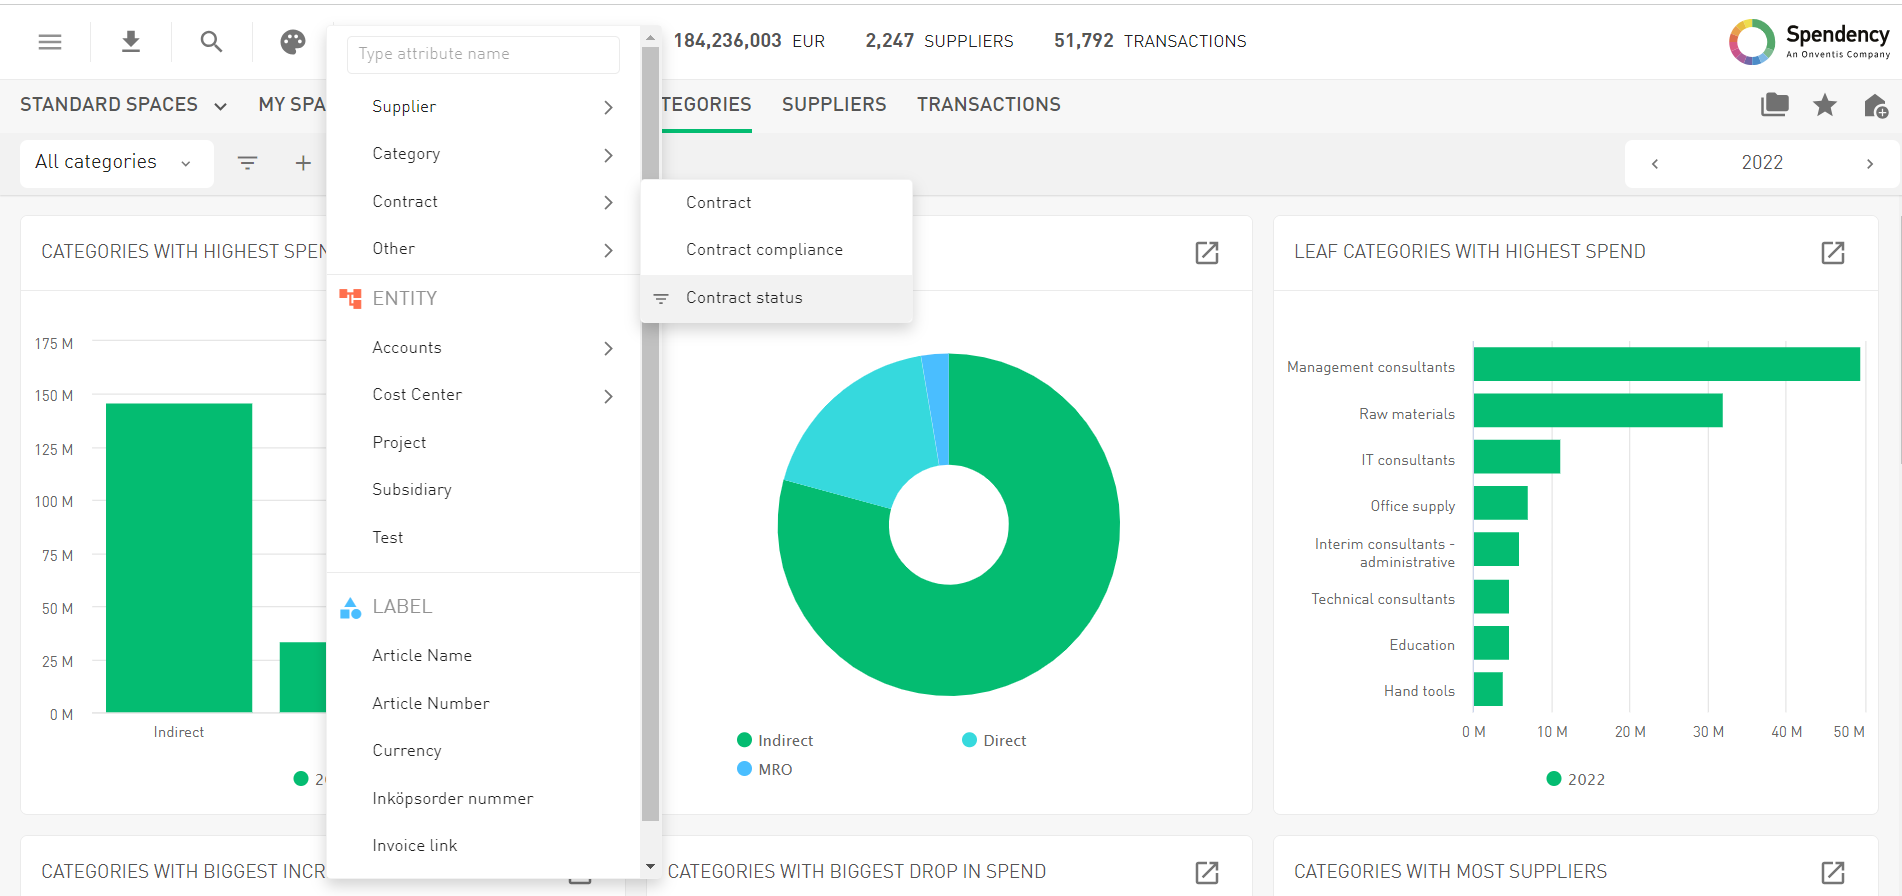
We changed the filter structure itself. You will now find a dedicated section for Contracts, which contain the filter options to filter for a particular contract, for contract compliance and overlapping contracts.
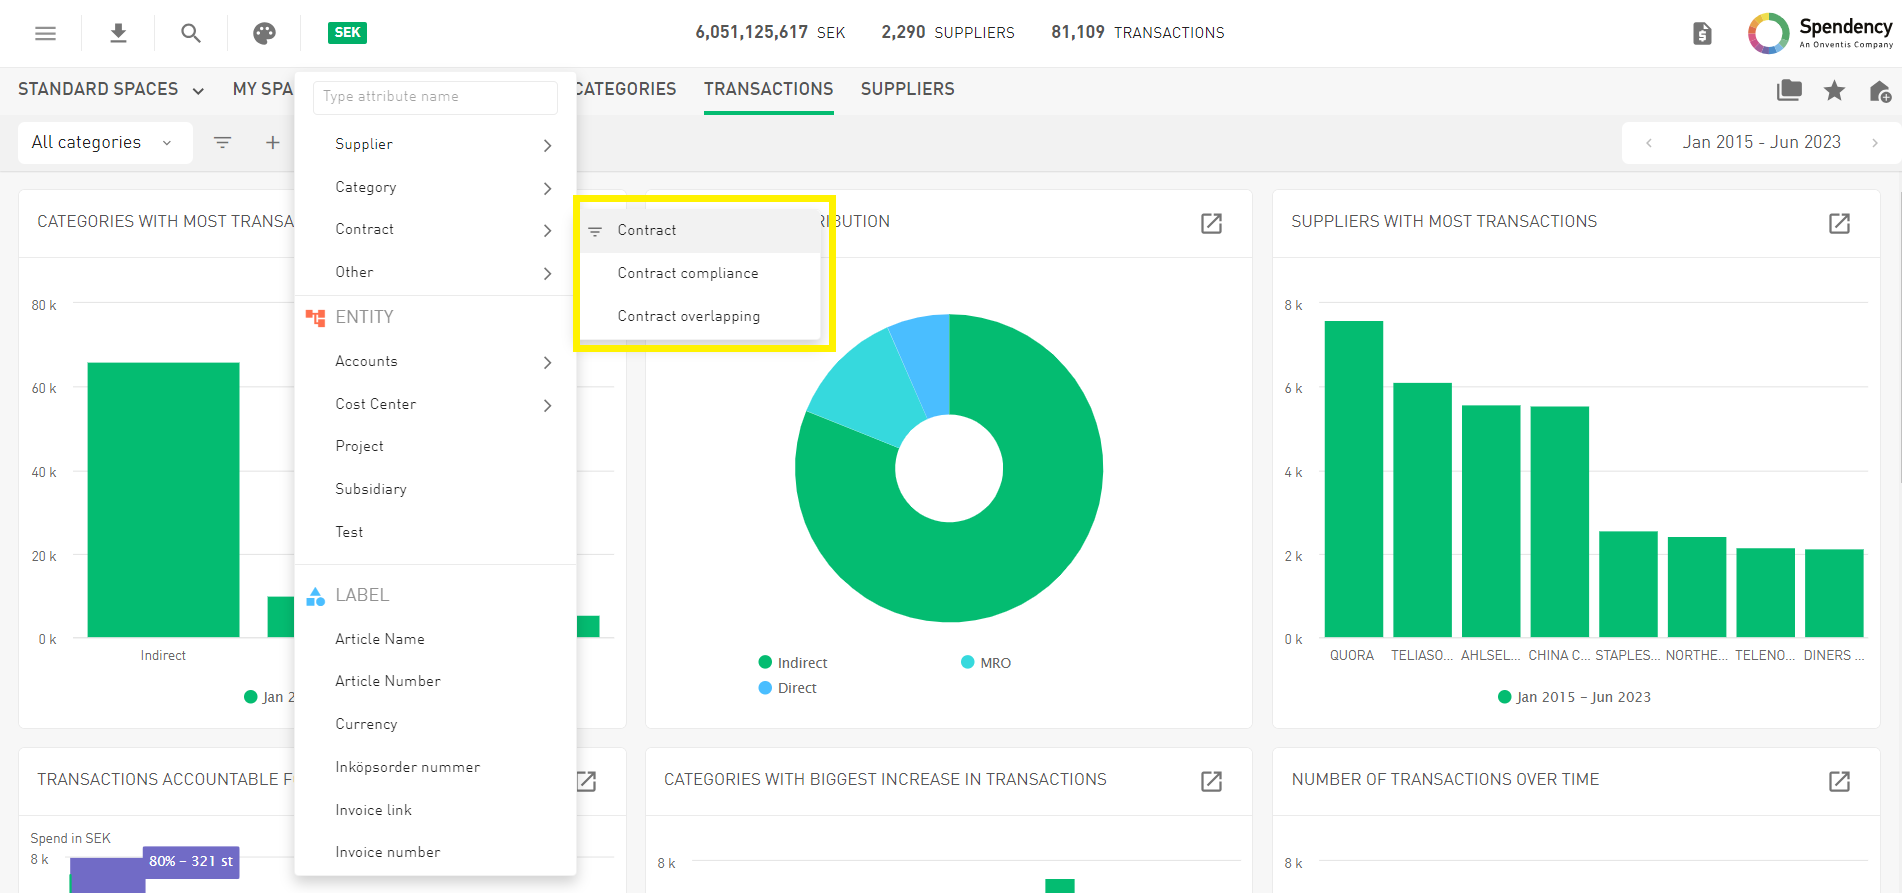
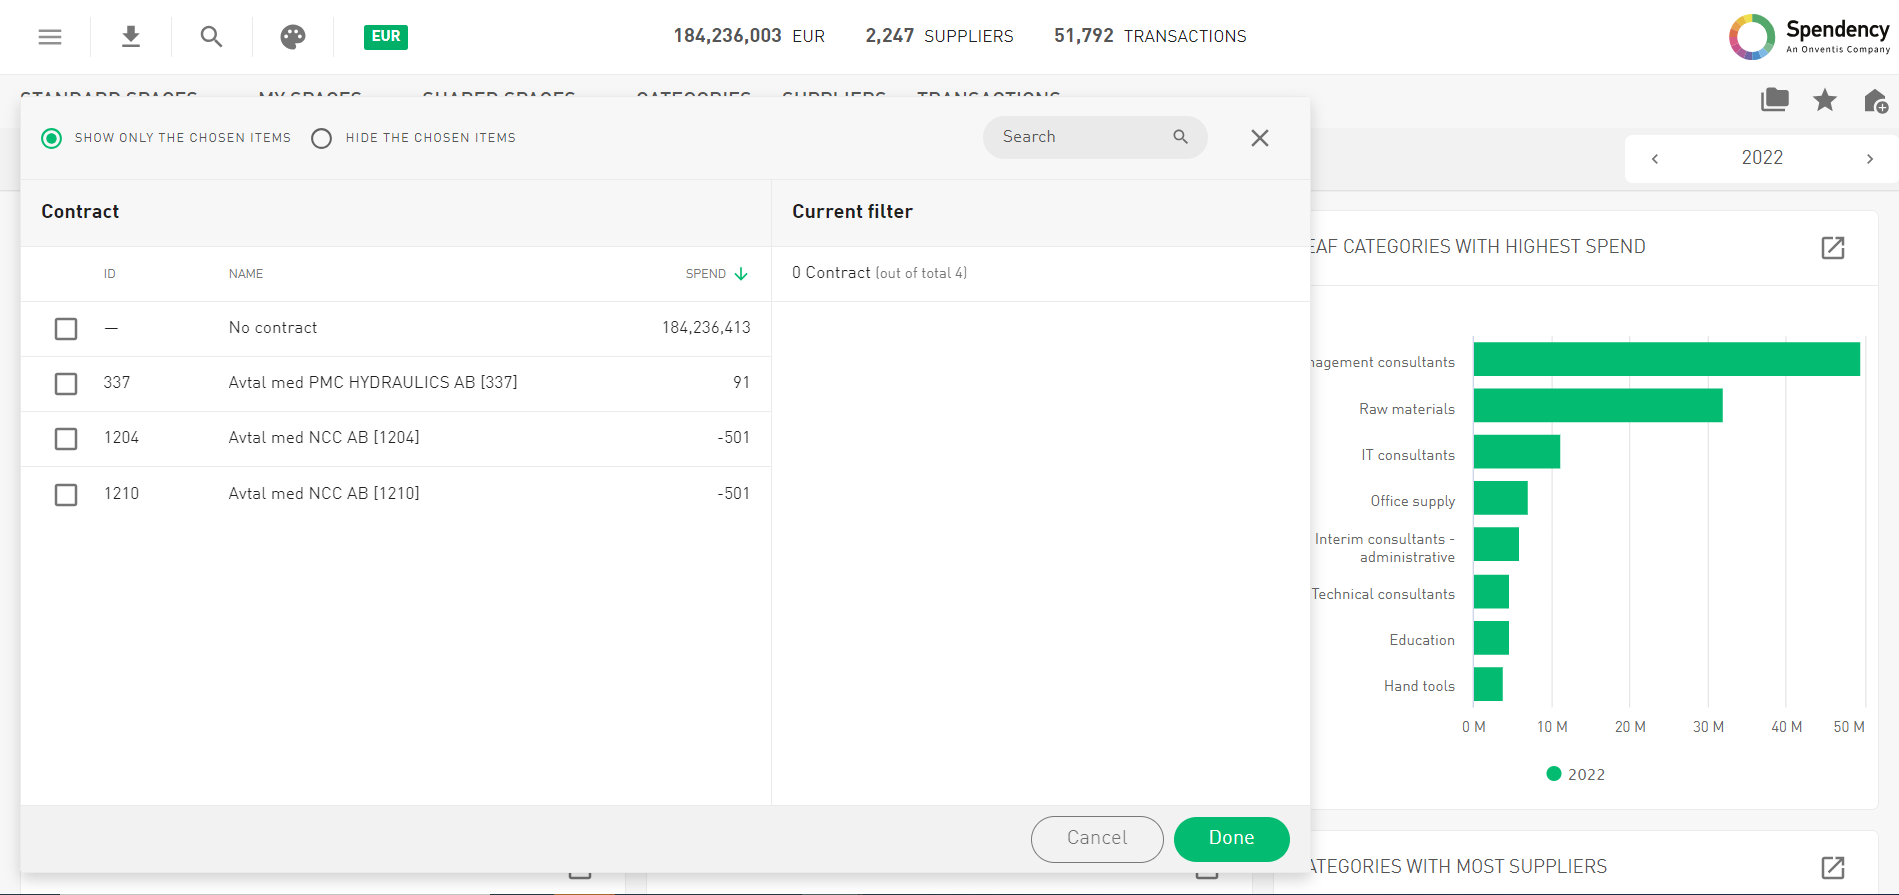
By selecting “Contract”, you are able to analyze your spend by particular contracts. Here you also find the filter option “no contract”, which shows you the spend which is not linked to a contract as well as list of all contracts available. Analyzing spend by particular contracts provides a focused understanding of financial commitments, aiding in cost control and preventing budget overruns. It facilitates the evaluation of supplier and contract performance, identifying areas for improvement and efficiency.
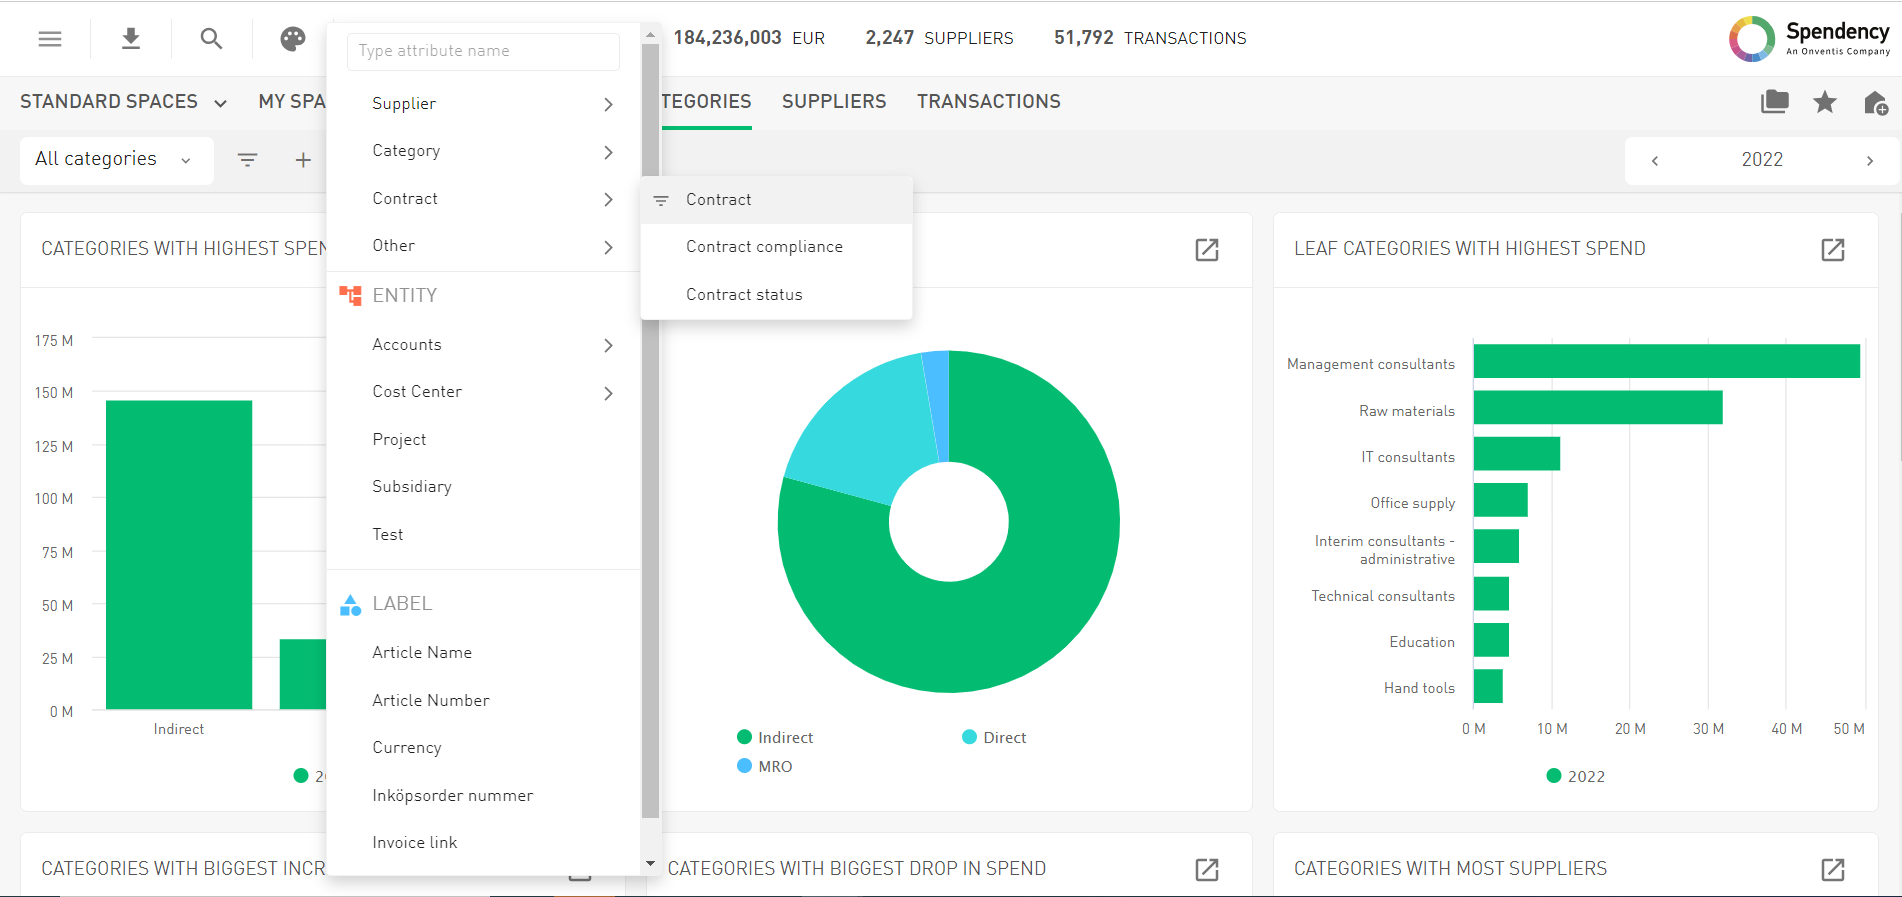
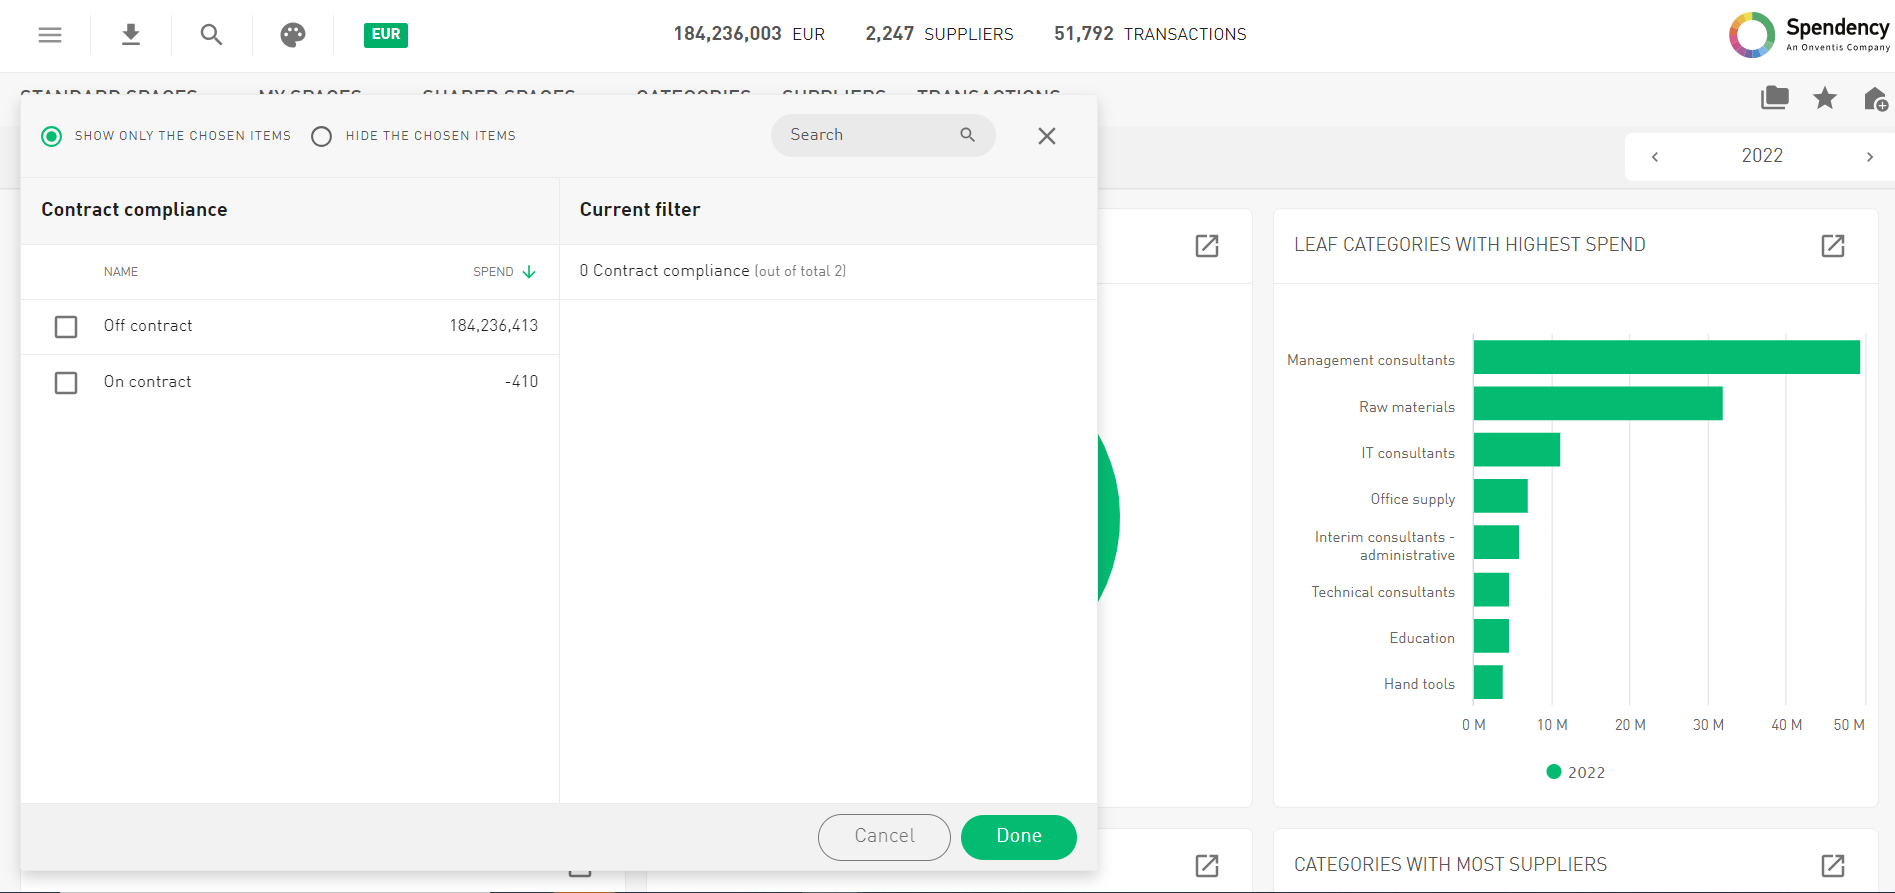
When selecting “Contract compliance” in the contract filter, you are able to filter for “on contract” and “off contract”. This allows you to analyze, how much of your spend is linked to a contract and which expenditures or purchases are made outside the terms and conditions of established contracts or agreements. Off contract spending can lead to problems such as loss of negotiated benefits, legal and compliance risks, and inefficient resource allocation. Contracts are designed to provide favorable terms, and deviating from them may result in increased costs and reduced control. By sheding light on the spend which is on and off contract, Onventis Analytics supports you in achieving contract compliance,
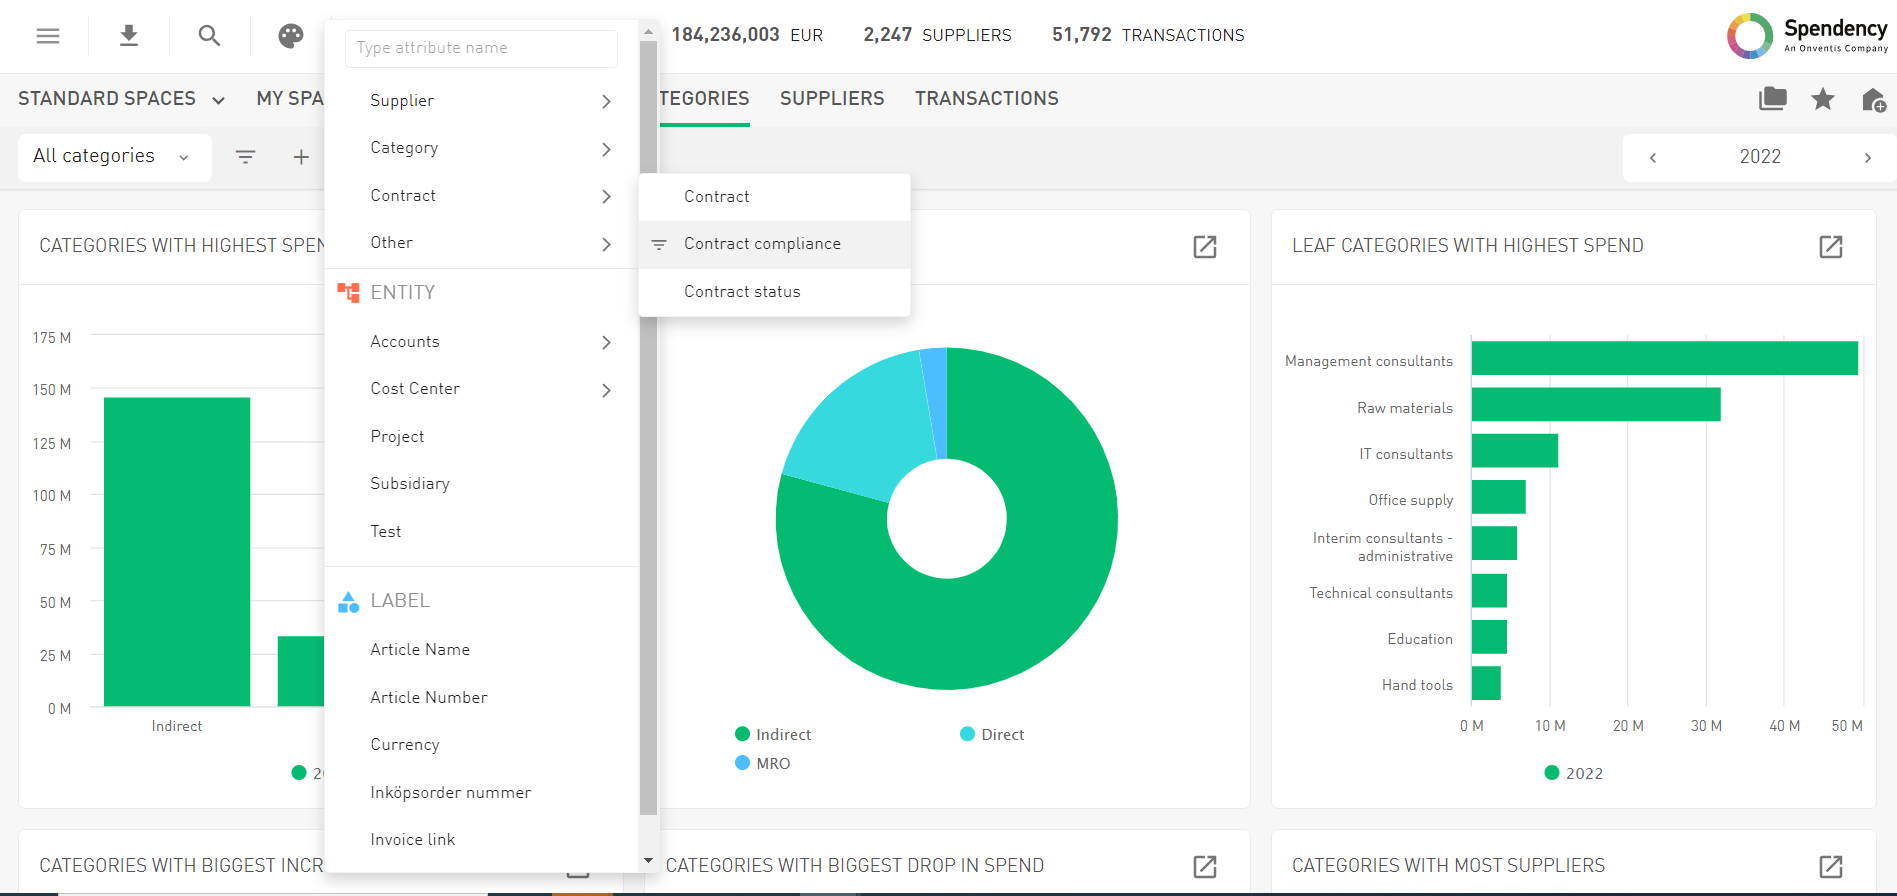
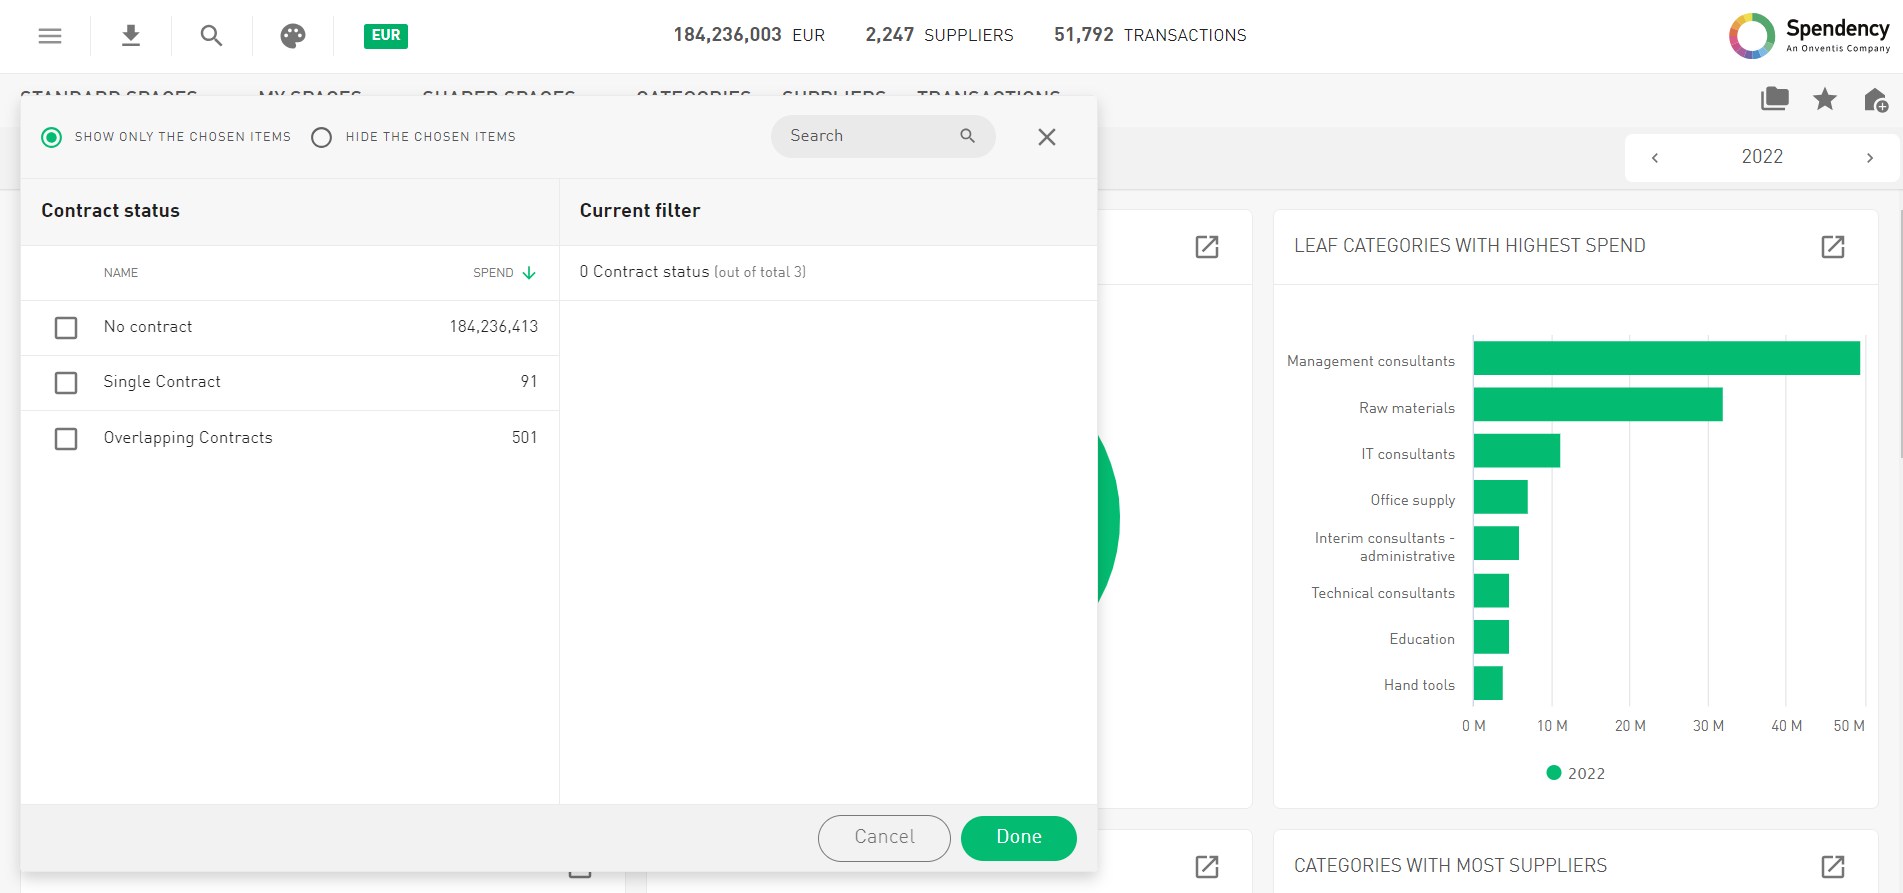
As mentioned above, analyzing spend by contract relies on proper contract data in order to allocate the spend to the right contract. With the “Contract Status” Filter we make it very easy for you, to check how much of spend can be linked to 1. no contract 2. one contract or 3. to multiple contracts as there are overlaps between them
Contract Compliance Space
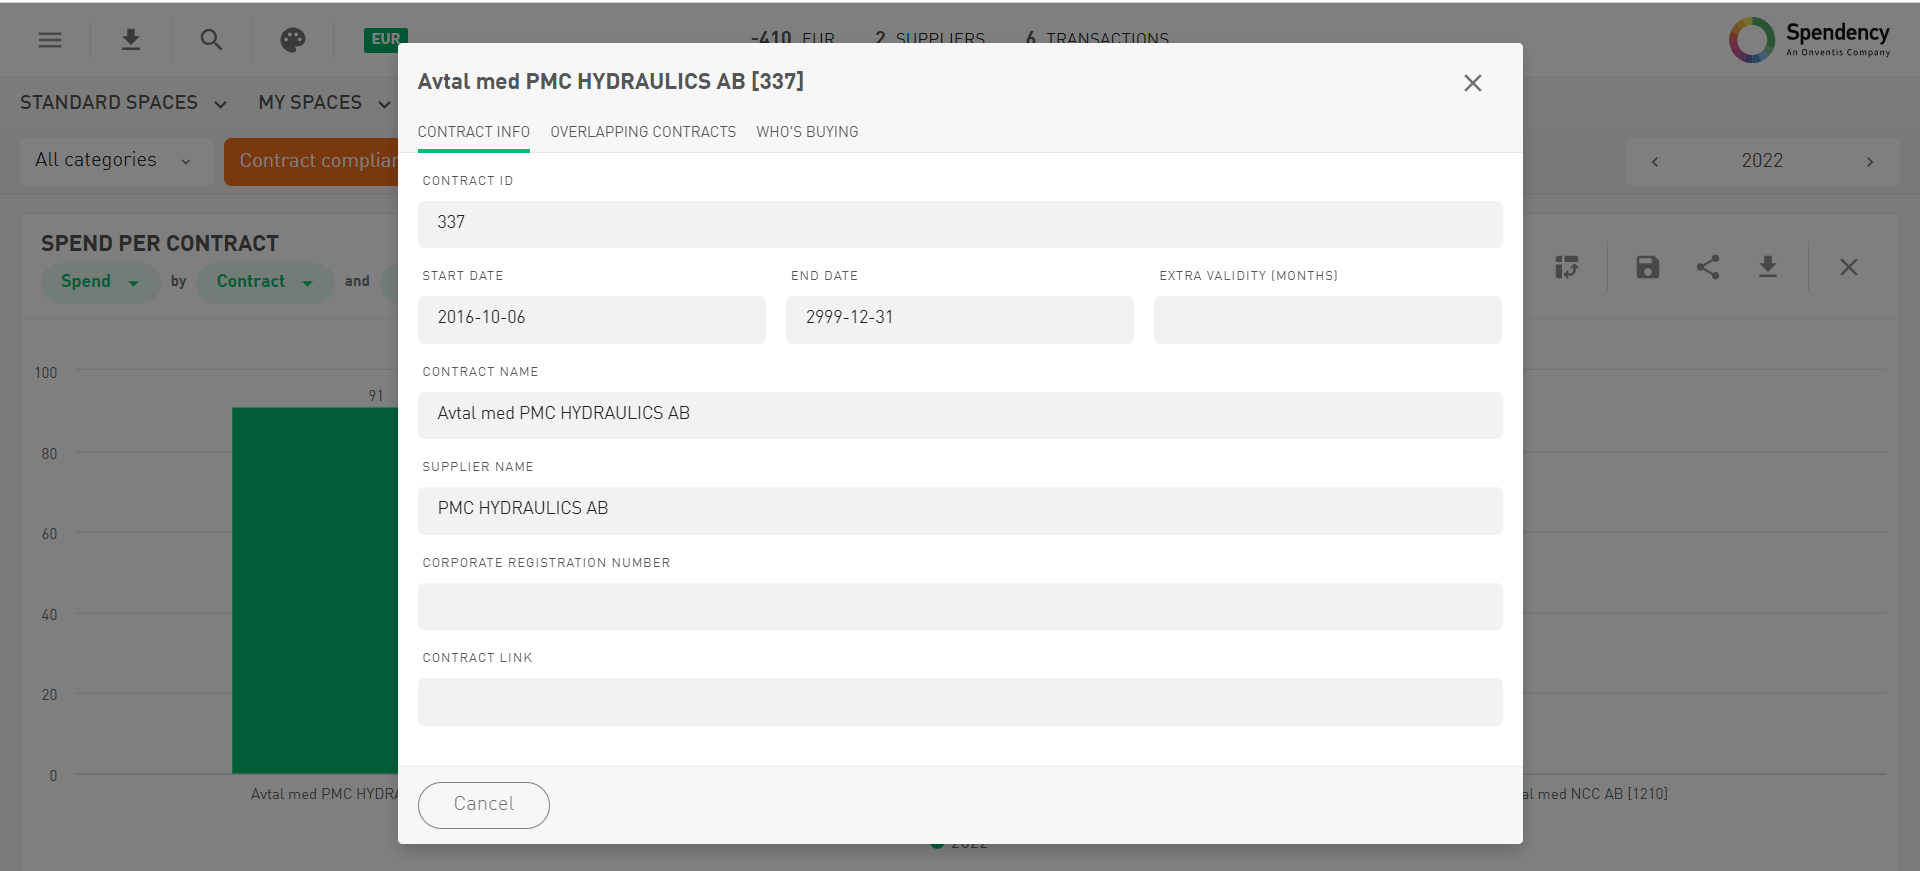
We also added a new default chart “Spend by contract” to the contract compliance space, to make it very convenient and easy to detect the contracts with the highest spend. Please note, this space is only available if you are using the contract module of Analytics.
When analyzing contracts you can now click on a particular contract in the chart to see all relevant information to this contract, similar to the supplier card.
New Datepicker
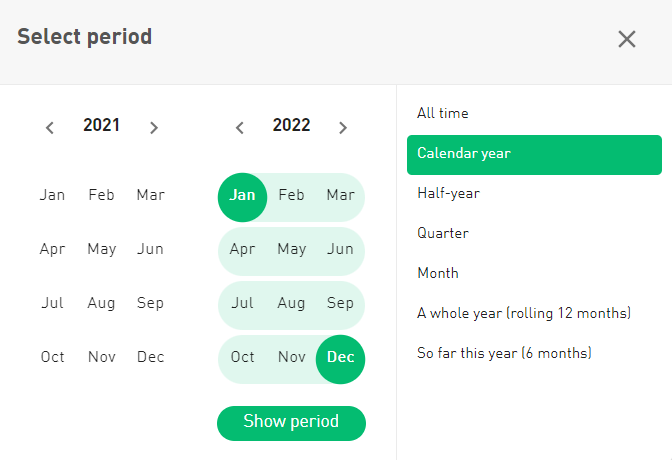
Our redesigned Date Picker is your time-travel companion, offering a delightful experience when choosing the perfect time period for your analysis. Navigate through time effortlessly with our curated selection of the following predefined options or by simply selecting a start and end month:
All time
Calendar year
Half year
Quarter
Month
A whole year (rolling 12 months)
So far this year (x months)
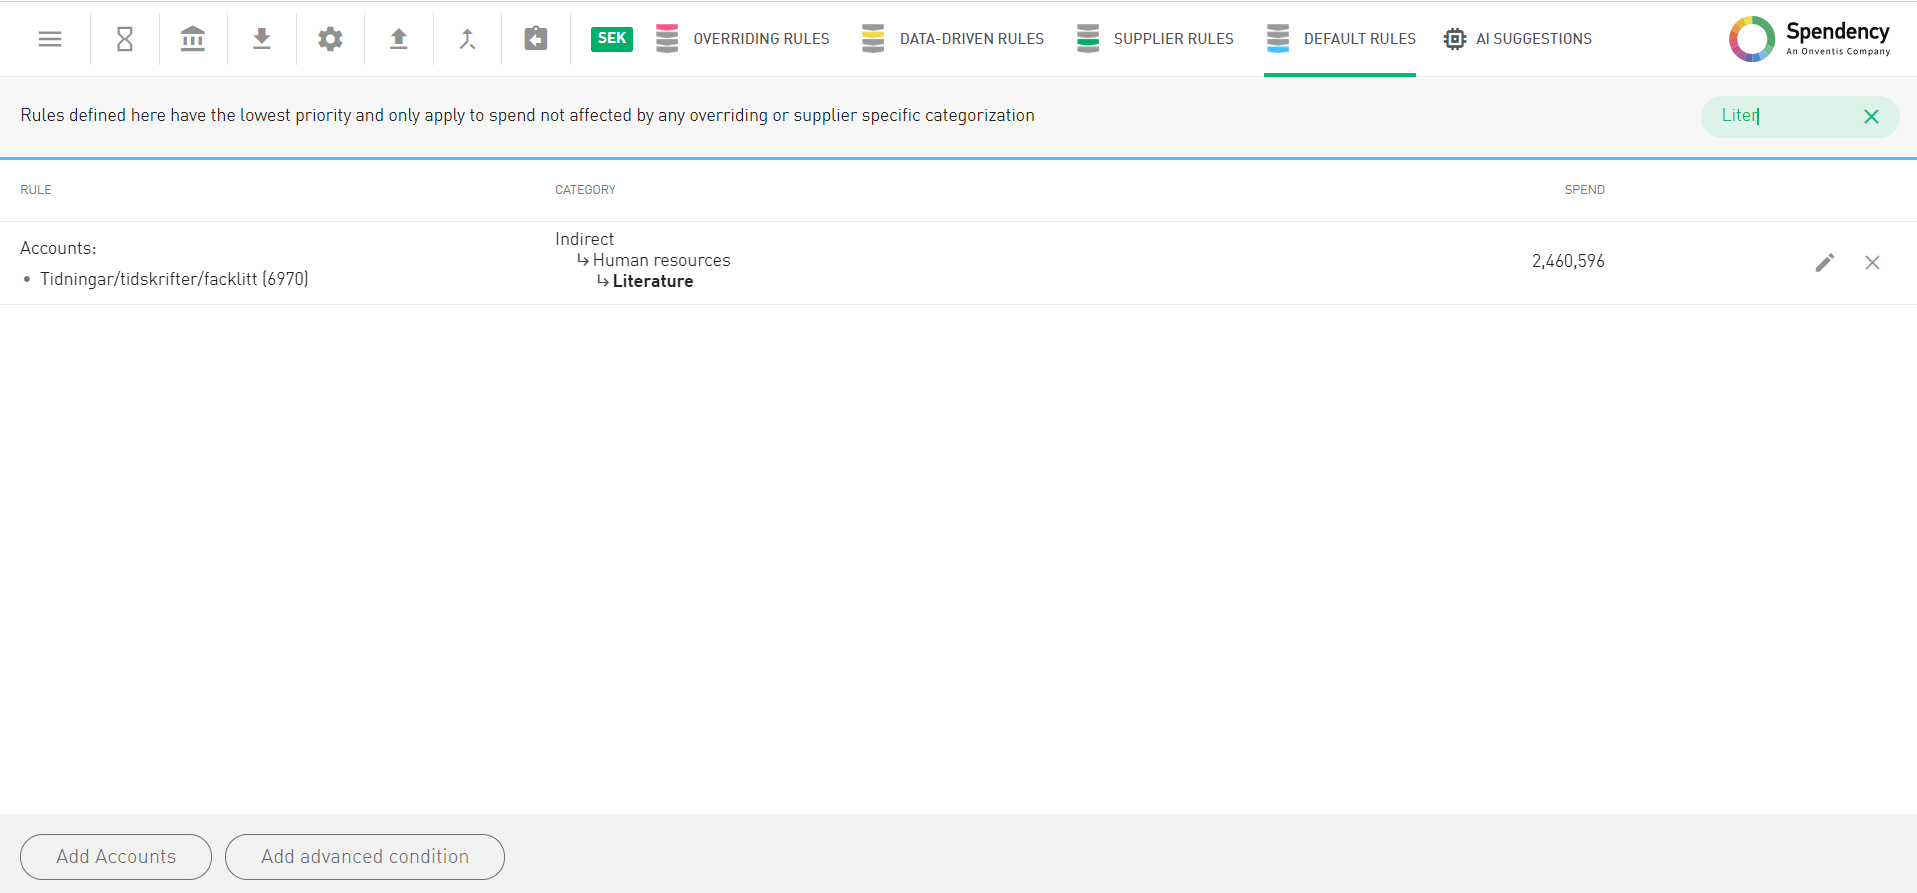
Searching in rules
With more display space and the brandnew Search Bar, you can illuminate the dark corners of overriding, data-driven, and default rules, casting a light on all your rules and categories. Working with rules has never been this seamless!
Copy a Space
Gone are the days of tedious space setup routines! With our latest enhancement, you’re not starting from scratch anymore. We’ve introduced a magical copy button, residing majestically in the right upper corner of a space. This copy icon not only duplicates your chosen space but also lets you define its destiny. Define a name, and decide whether it moves to “My Spaces” or joins the Shared Spaces.”
Going back in Charts
Sometimes you just want to go back. This has now been made easier when working with Charts.
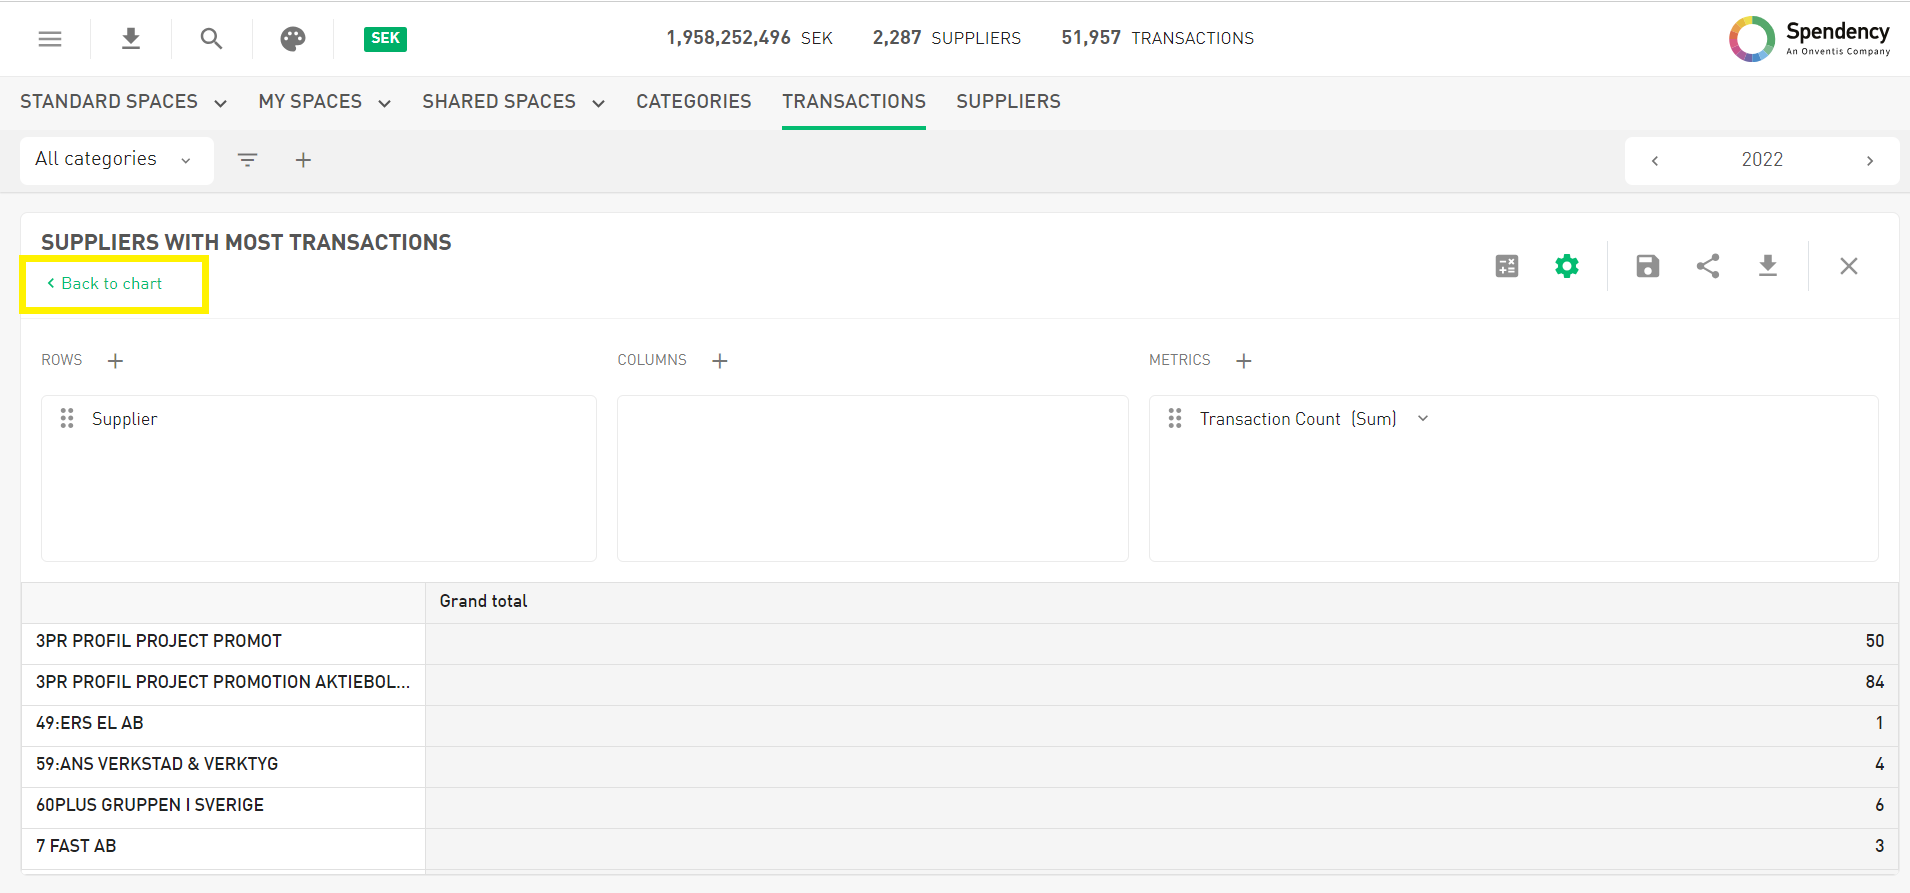
When you maximized a chart and change the type to a Pivot, Data Table or a Totals Box you will now see a button called “Go back to Chart” on left side below the headline. By clicking on this button you will be redirected to your inital chart.
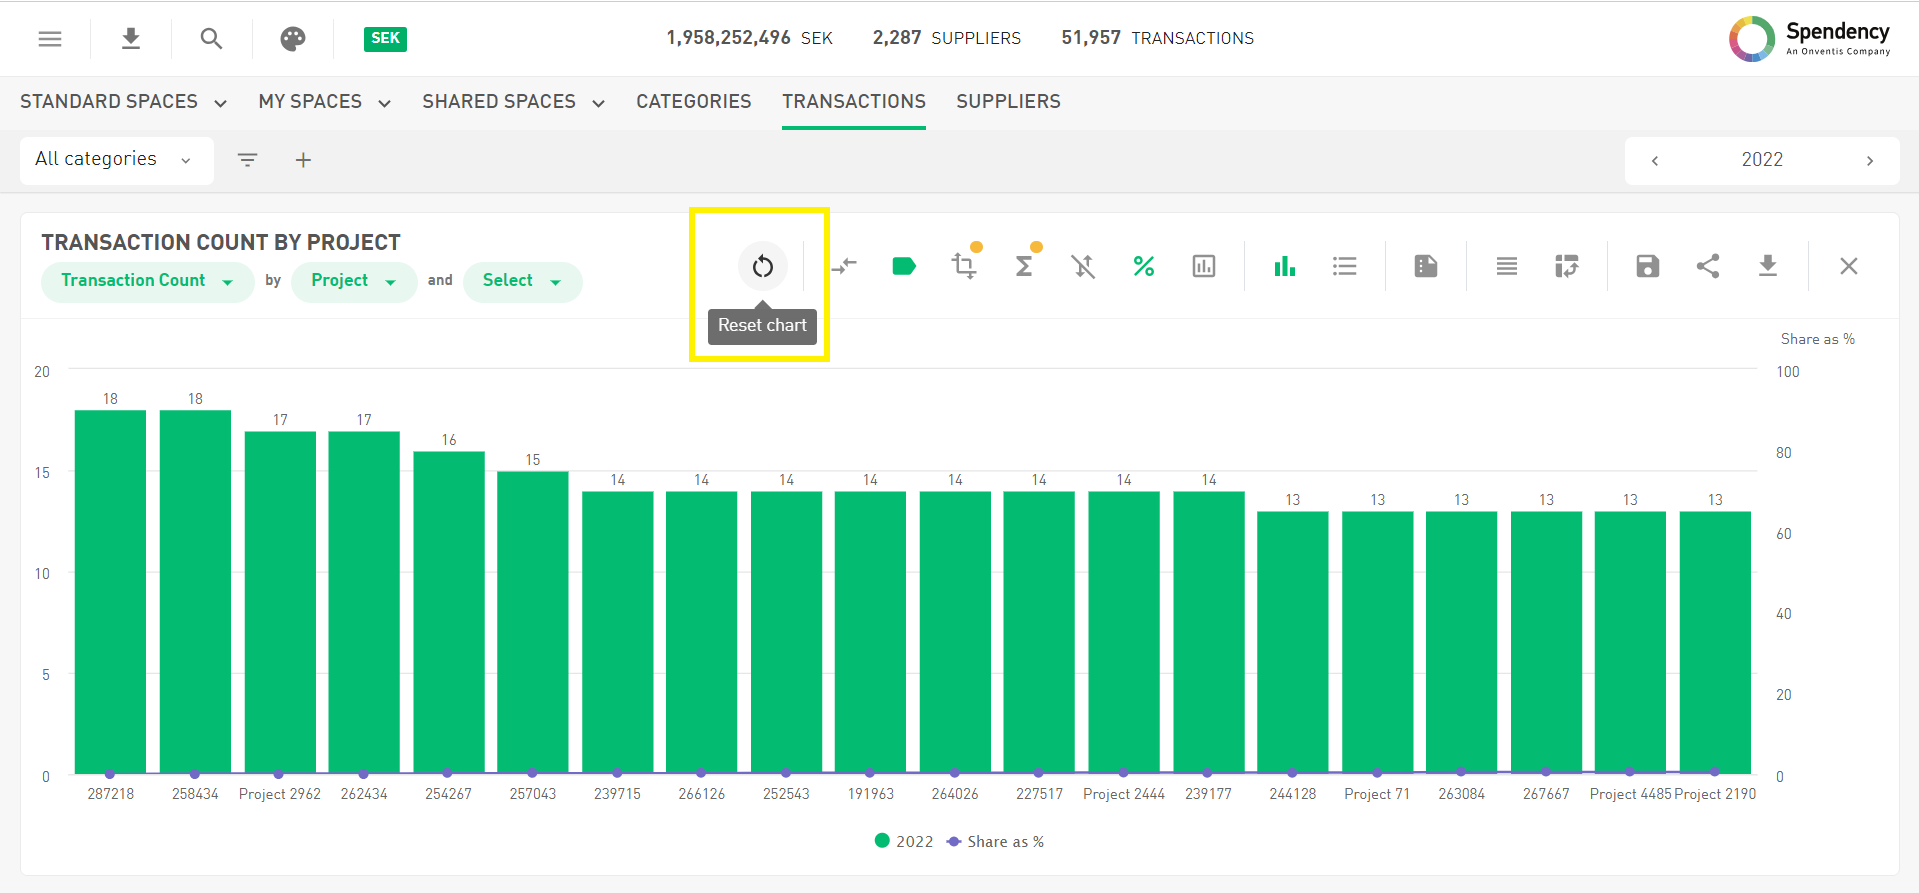
You played around with the chart and the data but changed your mind? No problem, you can reset your changes by clicking on the reset icon next to “show comparison”. By clicking on this button you reset your chart to the initial state.
Selected Filter in Export of a Chart
Ever wished exporting a chart would include a hint of selected category, applied filters and time periods? Your wish is our command! No more head-scratching – now, it’s all laid out for you in the exported chart on the bottom right corner.

Entities as Favorites
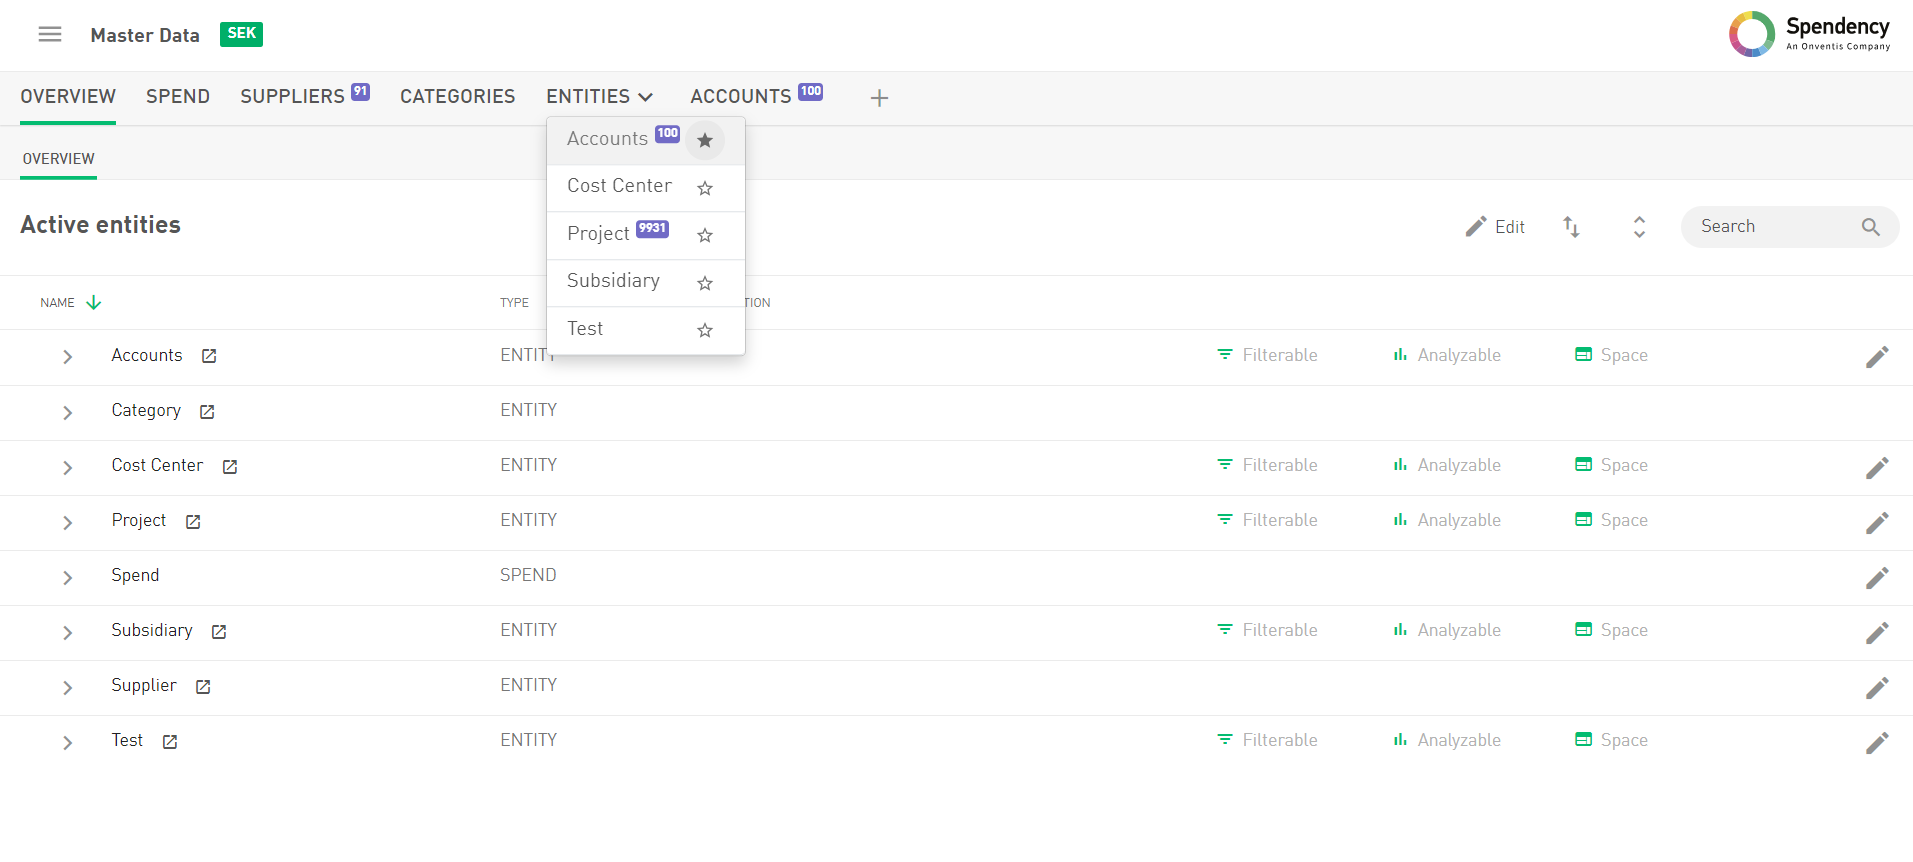
Everyone deserves their moment in the spotlight! In Master Data you are now able to set your most important entities as favorites by clicking on the star icon next to the entity name. Watch as your chosen entity rises to stardom, moving from the dropdown to its own VIP spot on the top menu.
Invoice URL as a Link
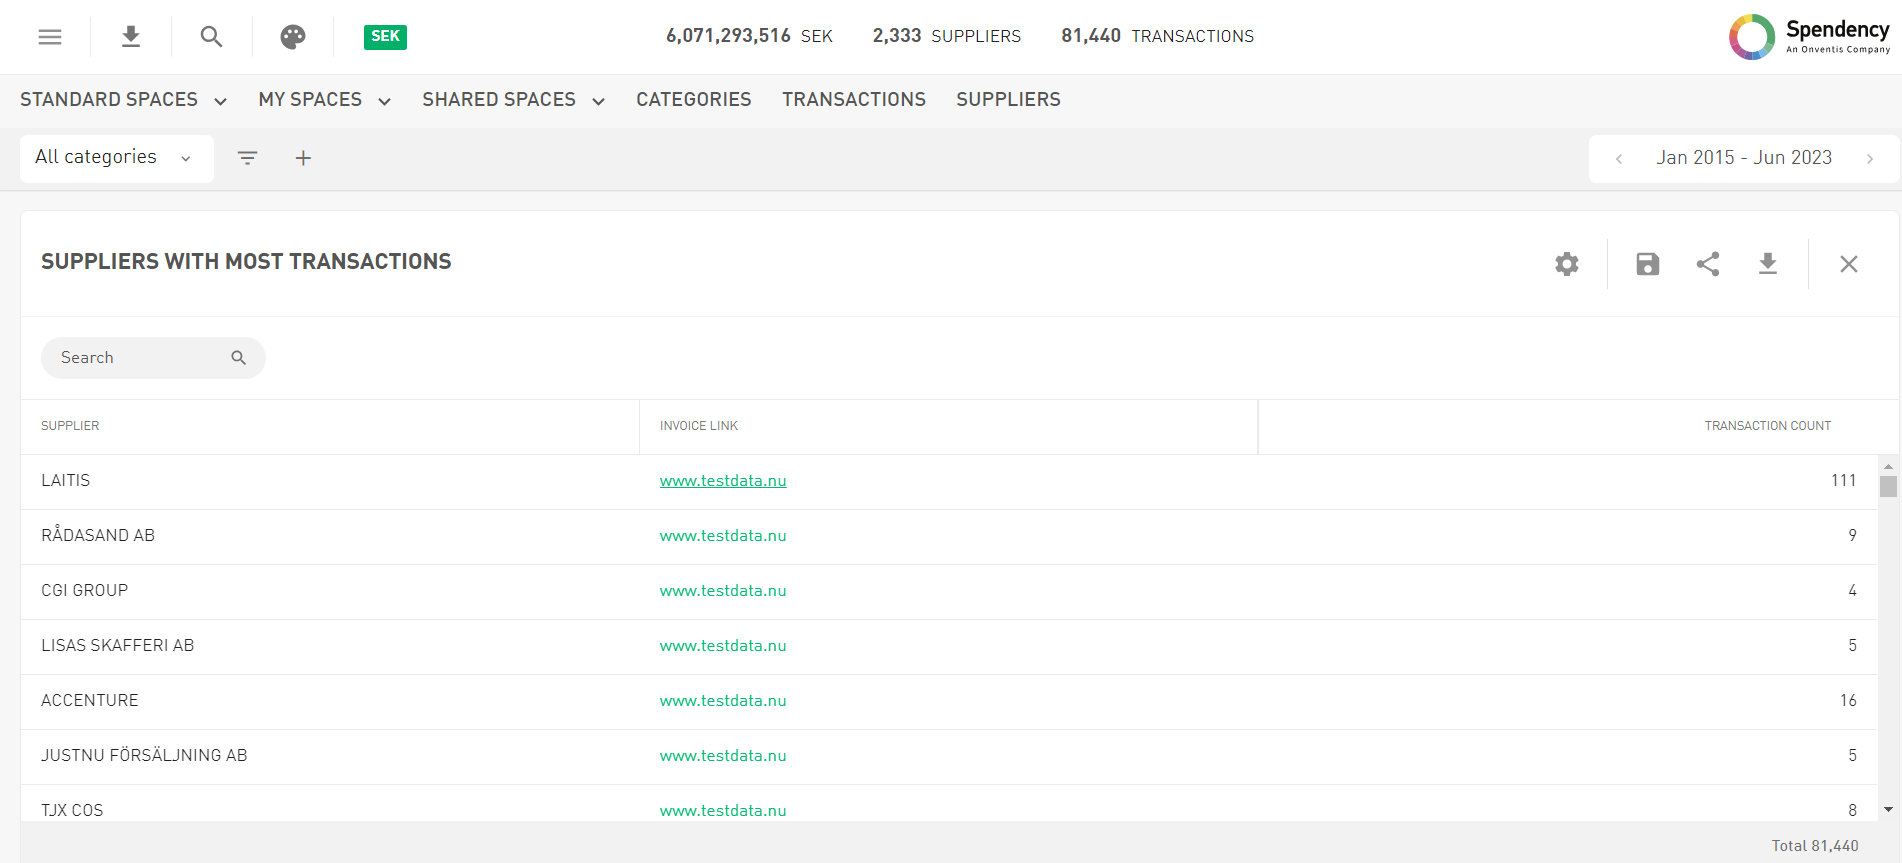
Your invoice is now just one click away. We are now providing the Invoice URL in a Datagrid as a Link, so you can directly jump to the Invoice by clicking on the link.
Configuration of future Dates to be analyzed
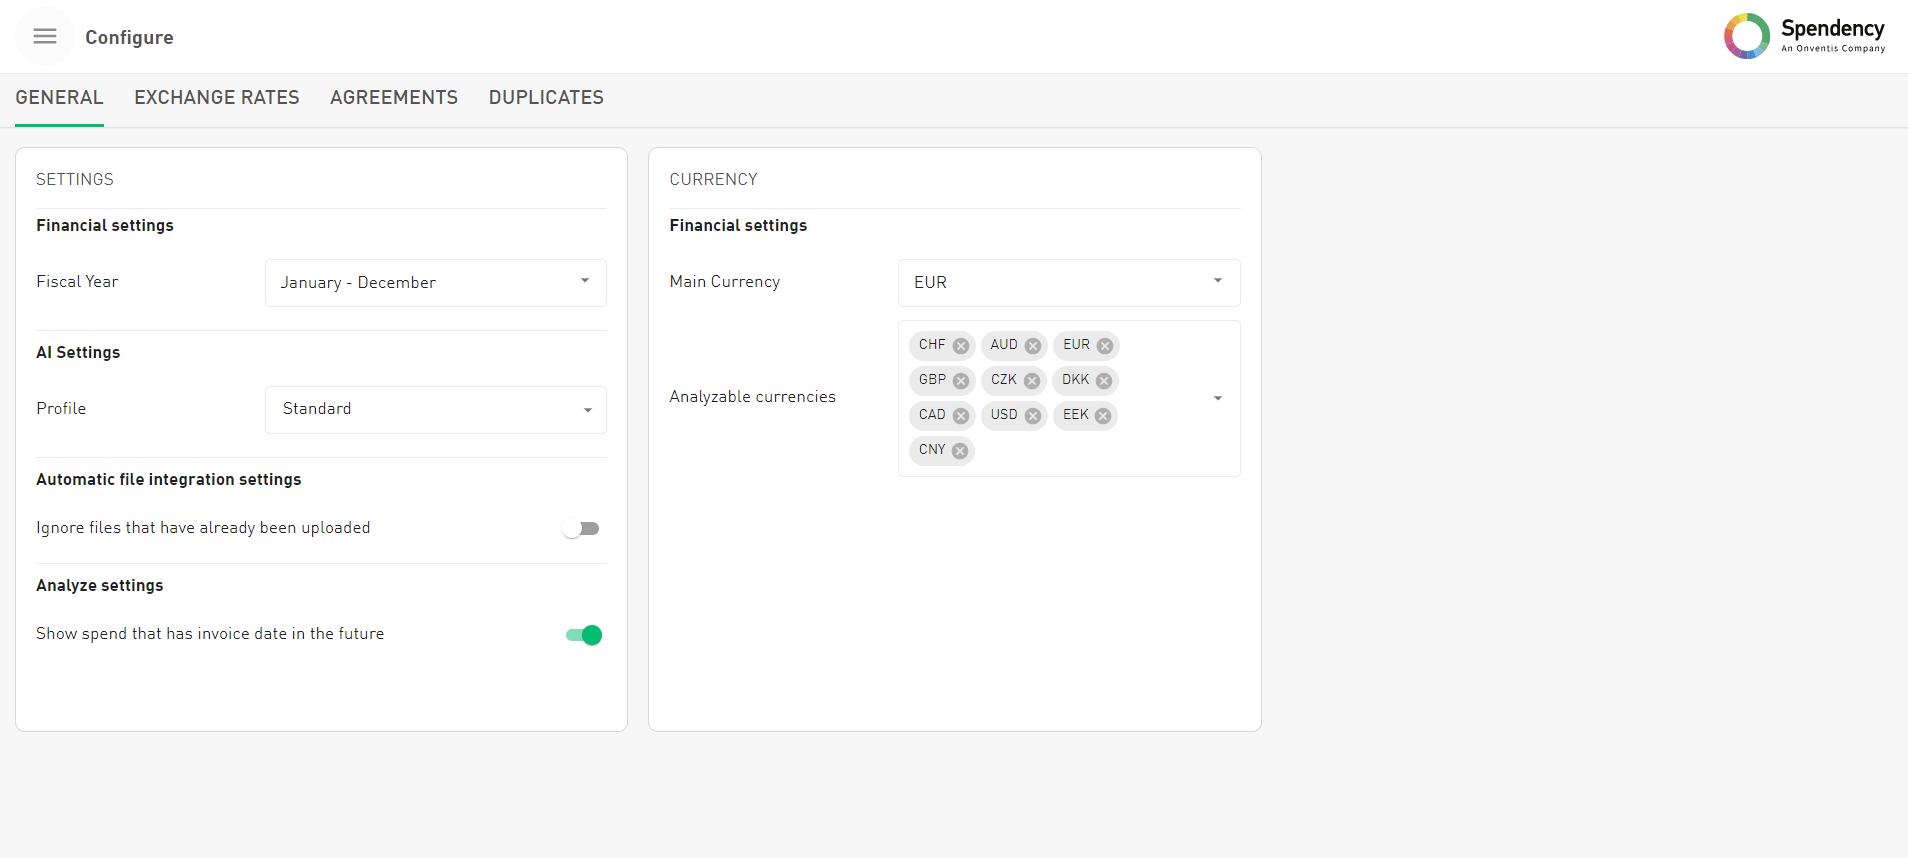
Ever wished you could control the flow of time in your analysis? Analyze the future or keep it locked away – the choice is yours! In the configuration section you are now able to decide whether you want to analyze future dates or not. This prevents confusion and crafts a user-friendly experience in case your data holds dates in the future.
Configuration of Currencies to be analyzed
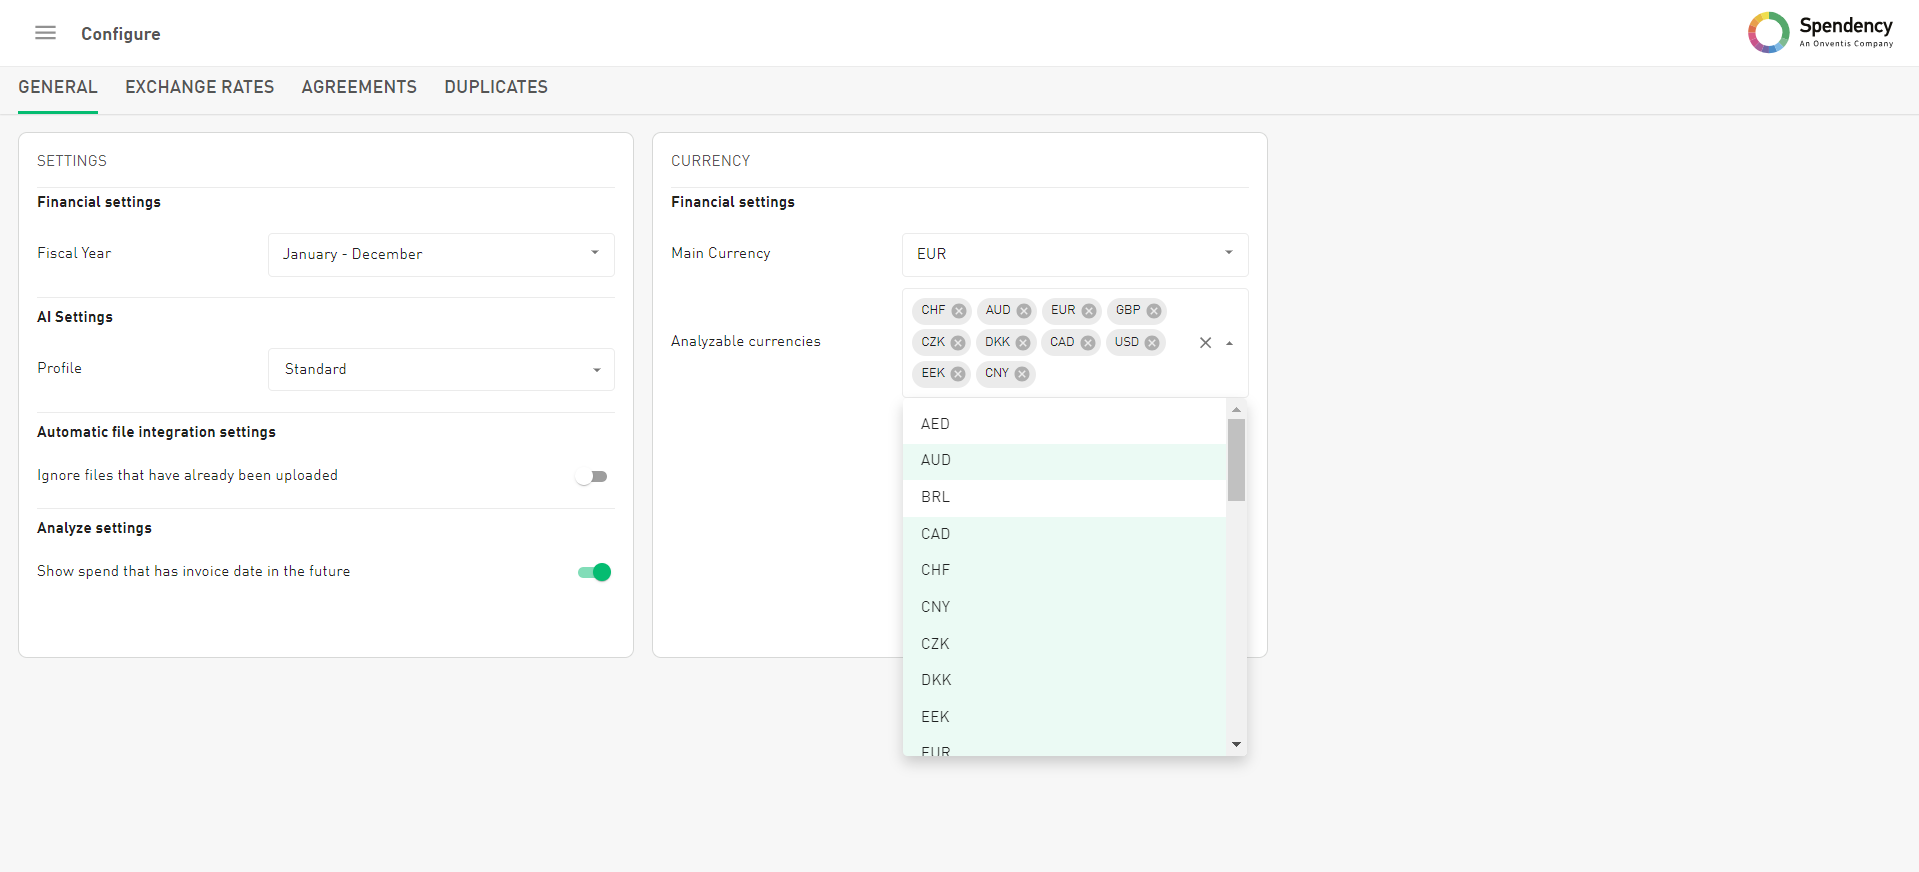
Say goodbye to currency clutter! In the configuration section you are now able to define in which of the currencies should be available on the Analyze page. By selecting only the relevant currencies, you can trim down the Analyze page currency list to only show the chosen ones.
Exchange Rates in an own Tab
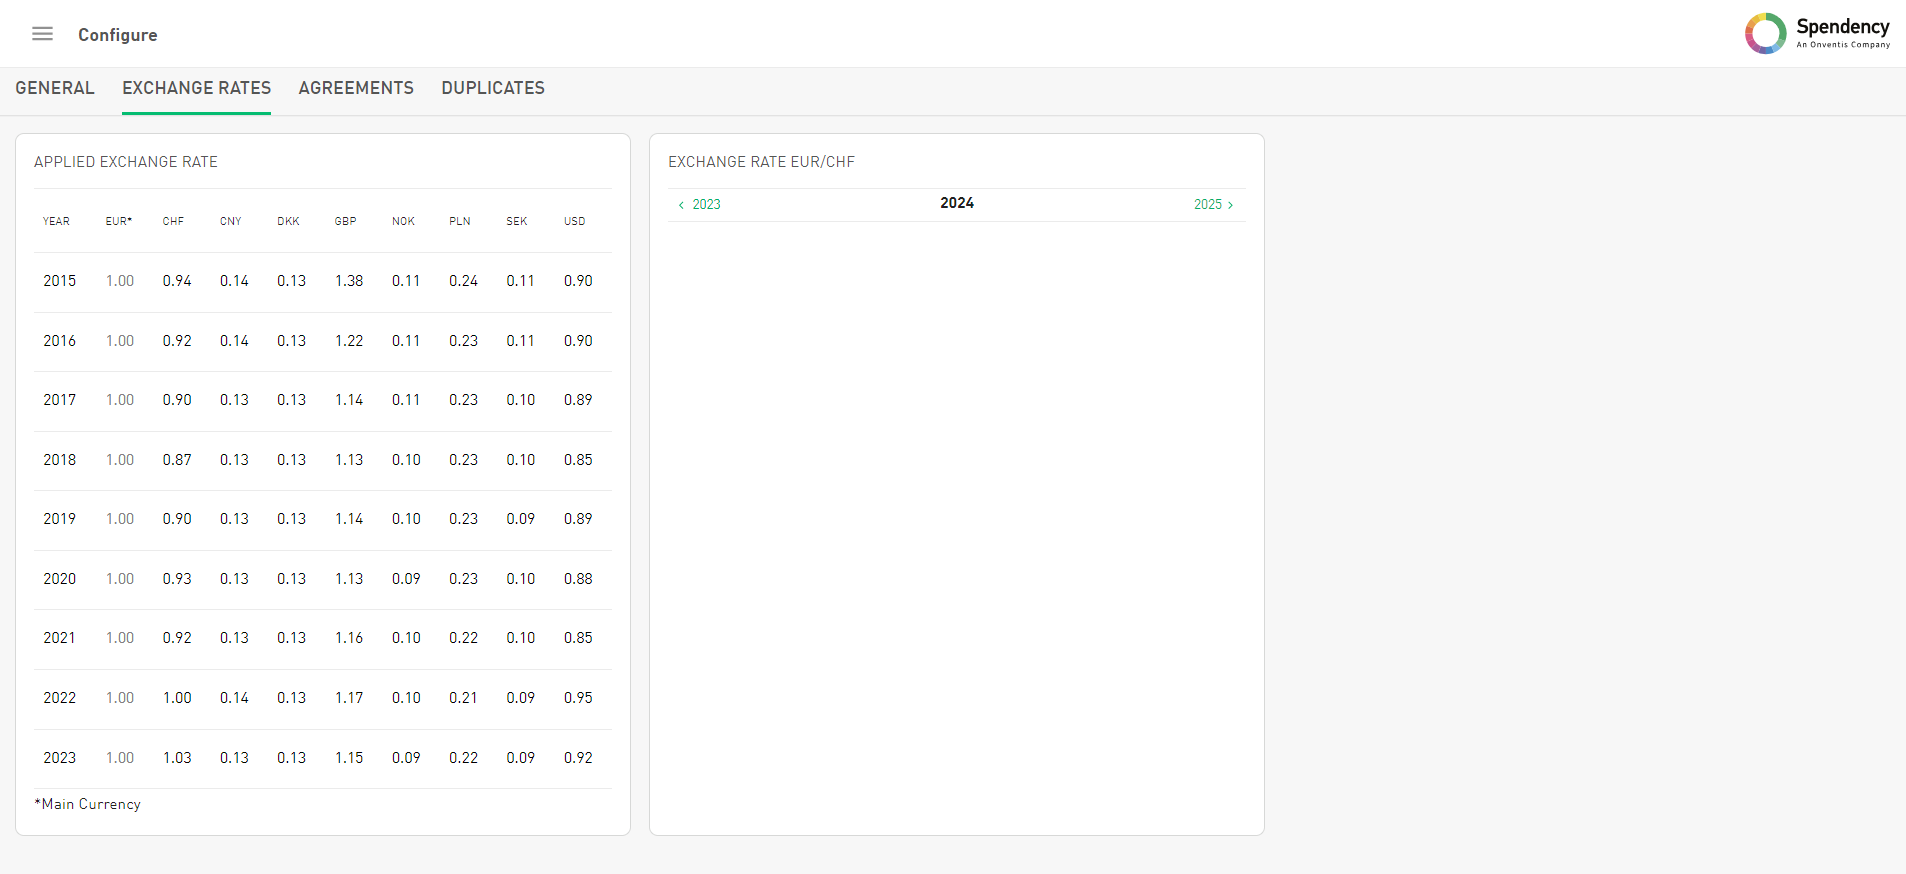
We’ve gave exchange rates their own exclusive tab in the Configuration section. It’s like a VIP lounge for all currency related information. Now, neatly organized, you’ll find the applied exchange rate and the exchange rate for your selected currency.
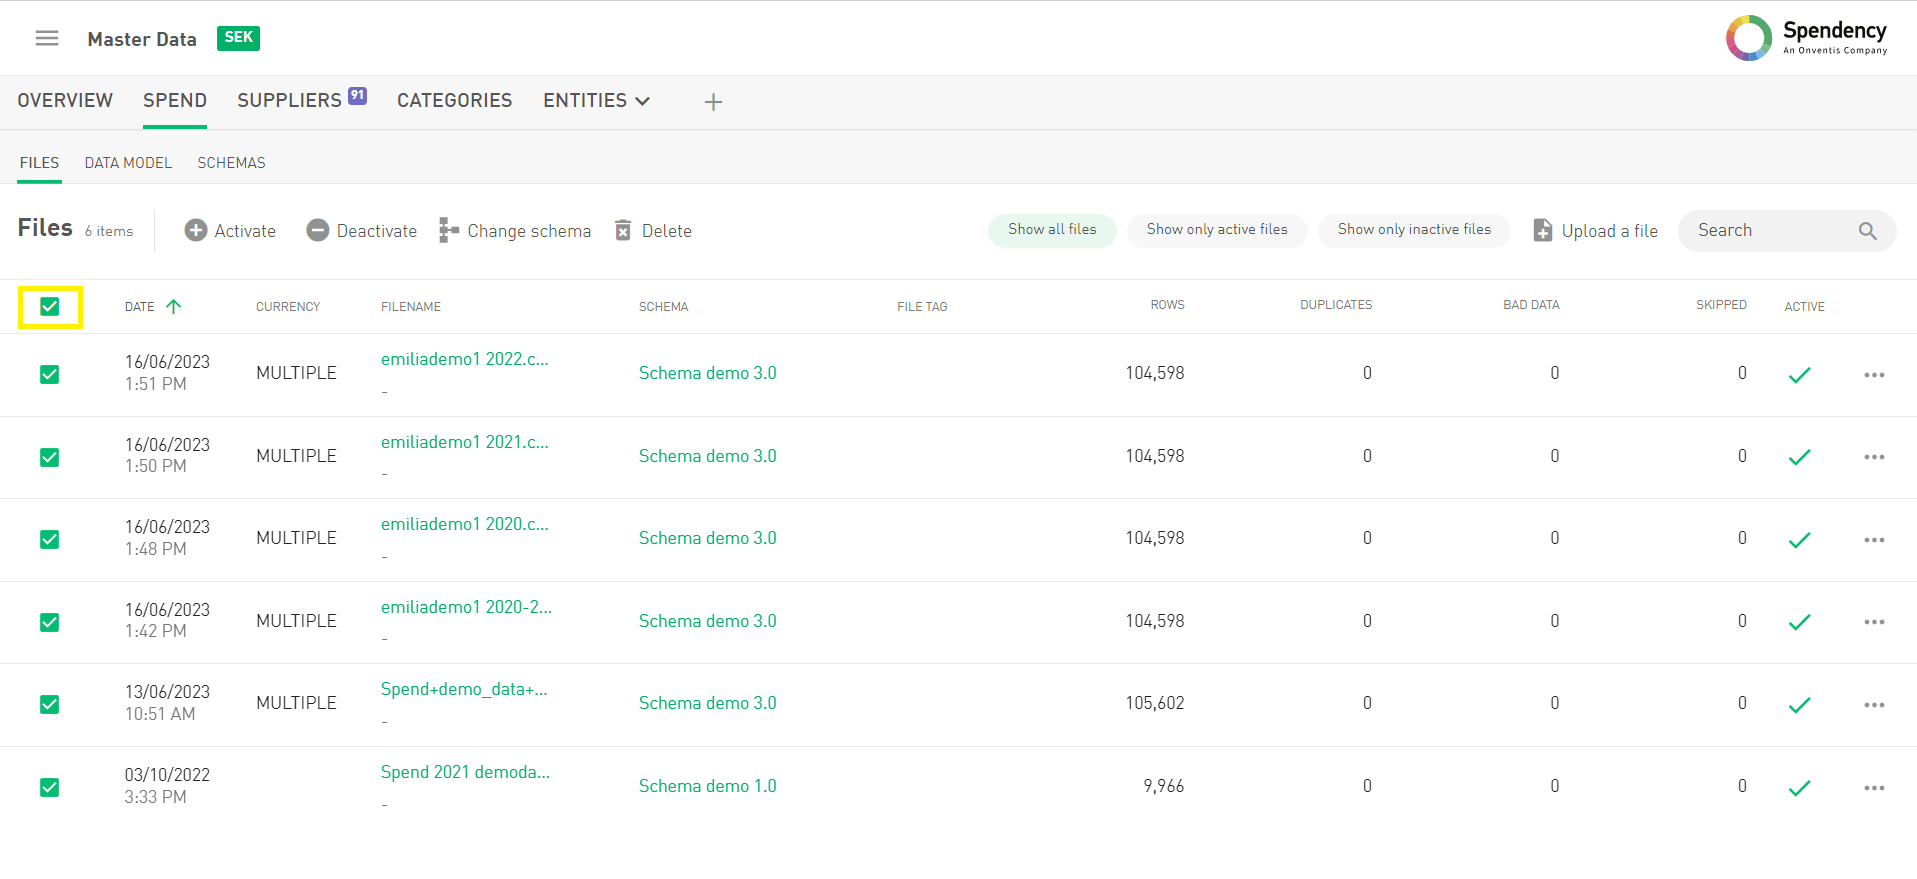
“Select all” checkbox in Files and Schema
The power of a single click! In Masterdata you are now able to select or delesect all files and schemas with just one click. This allows you to easily activate or deactive spend files or to delete files and schemas for entities.
OpenAI as a Data Provider
We are pleased to announce a sophisticated enhancement to our supplier categorization mechanism. This release marks the integration OpenAI, as a distinguished data provider for more comprehensive supplier insights. With the inclusion of GPT-4, a sophisticated language model trained by OpenAI on an extensive dataset from the web, we increase the likelihood of obtaining descriptions about suppliers that allow us to provide even better supplier categorization suggestions.
The Approach: Our approach is meticulous and follows a two-tiered process. Initially, we exhaustively query our database and consult our existing data providers to obtain a description of the supplier. In cases where such information remains elusive, we prompt GPT-4 to generate a detailed description. The description provided by GPT-4, then serves as a foundation for the subsequent categorization of the supplier through our AI model.
Assurance of Data Privacy: It is paramount to highlight that, we solely provide the supplier name to GPT-4 and no customer specific information. Further, using the enterprise version of GPT-4, we adhere to the highest standards of data privacy. Prompts and data are expressly excluded from any involvement in the training of models, ensuring the confidentiality and integrity of proprietary information.
E-Mail when AI Job is finished
Executing the AI Job may require a bit of patience. Because we understand your time is precious and staring at the loading spinner isn’t your idea of fun, we’ve decided to keep you in the loop. Expect an email notification from info@spendency.com once the AI Job has gracefully completed its tasks, inviting you to explore the newly generated AI suggestions at your convenience.
