
Onventis Analytics 2026.1
Welcome to Onventis Analytics 2026.1!
This release puts time back on your side. Our new first-time process metrics for Onventis Buyer give you a crystal-clear view of how long purchase orders take—from creation, to submission for approval, to final sending. These metrics help you pinpoint delays caused by incomplete data, manual checks, or waiting for confirmations—so your team can act faster and smarter.
Beyond that, we’ve made spend analytics faster, clearer, and more collaborative. Fiscal years now show the year they end, keeping your reports consistent with international accounting standards. Filters can be shared across teams, so your best setups aren’t trapped on your own screen. Multi-value fields like CRNs and organization numbers now have a single display value, making charts, tables, and exports easy to read. Rule logic is crystal clear—text conditions are now explicitly AND—and the UI has been upgraded to MUI, boosting performance, responsiveness, and reliability.
It’s a release that combines deep insight, smoother visuals, and smarter teamwork—helping your team act with confidence and keep processes moving at the speed of business.
2026.1 Release date:
New in Analyze 📊
New! First-Time Process Metrics for Onventis Buyer ⏱️
We’re putting the stopwatch on your purchase order process—because knowing where time slips away is the first step to speeding things up. Our first-time process metrics give you a clear view of how long different steps actually take, based on timestamps in your purchase order data. All calculations are based on a 7-day week and 24 hours per day, so you get the full picture—even if orders sit around on weekends.
Here’s what you can track:
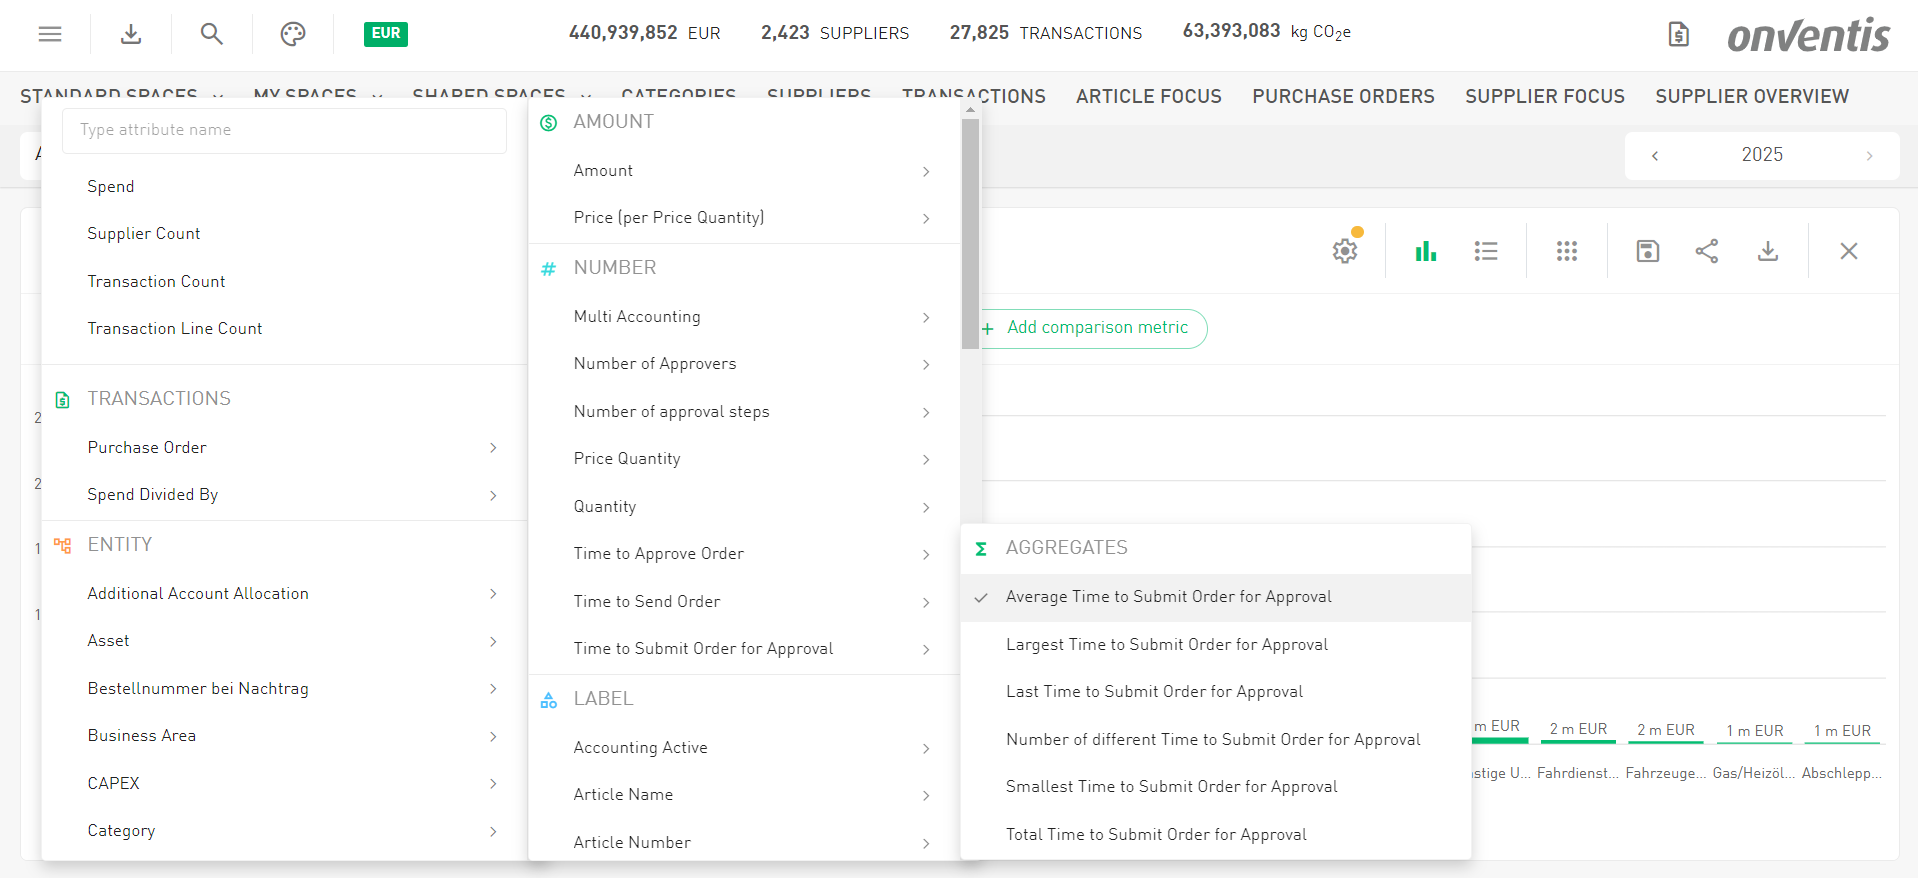
Time to Submit Order for Approval
Calculated as: Approval Start Date – Order Create Date
This shows delays caused by incomplete order data, manual checks, or waiting for internal confirmations. Orders no longer vanish into a drafting black hole—they now show exactly how long they linger before entering the approval process.
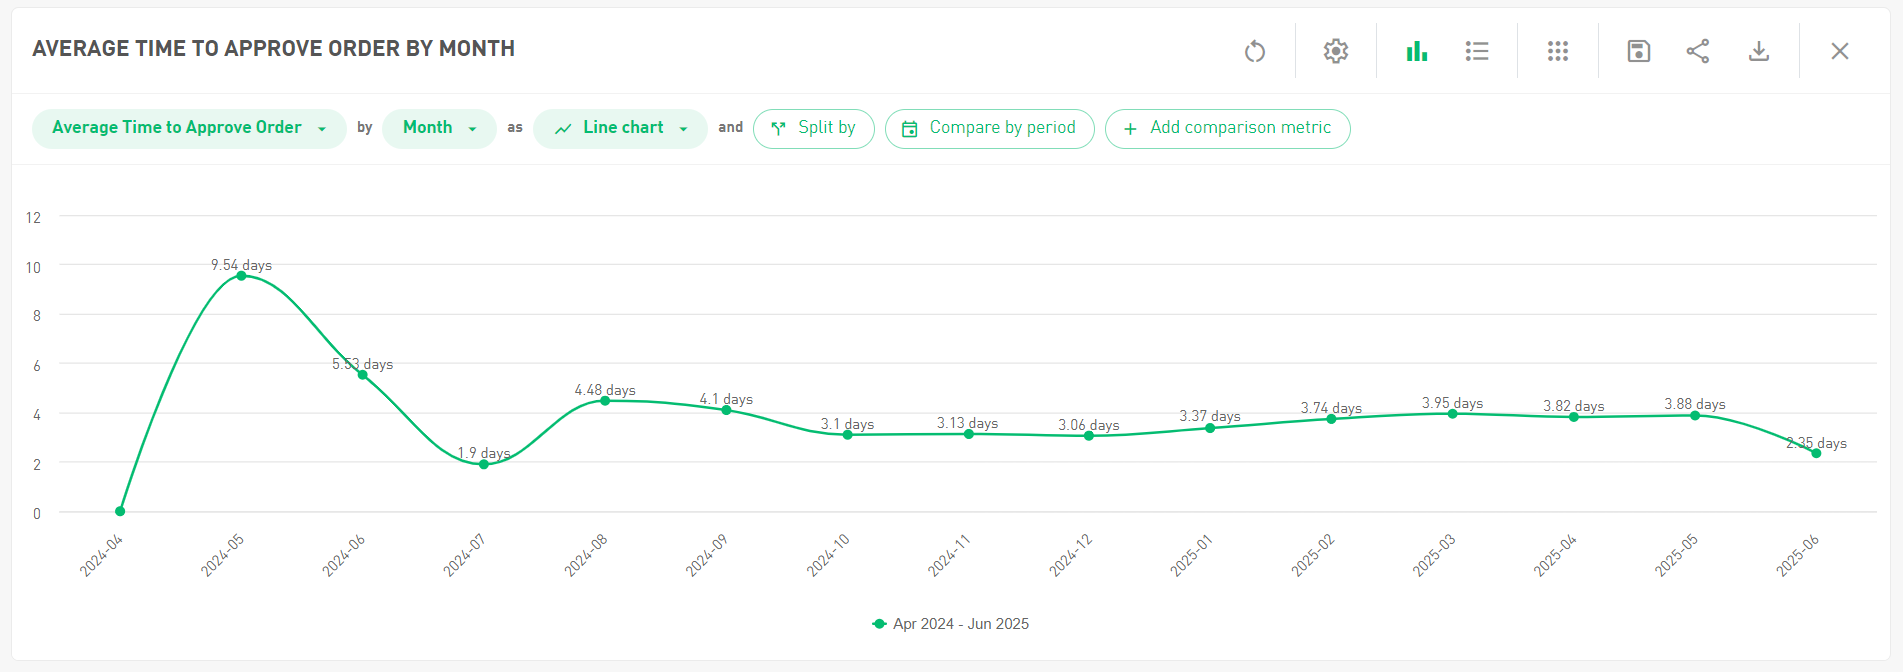
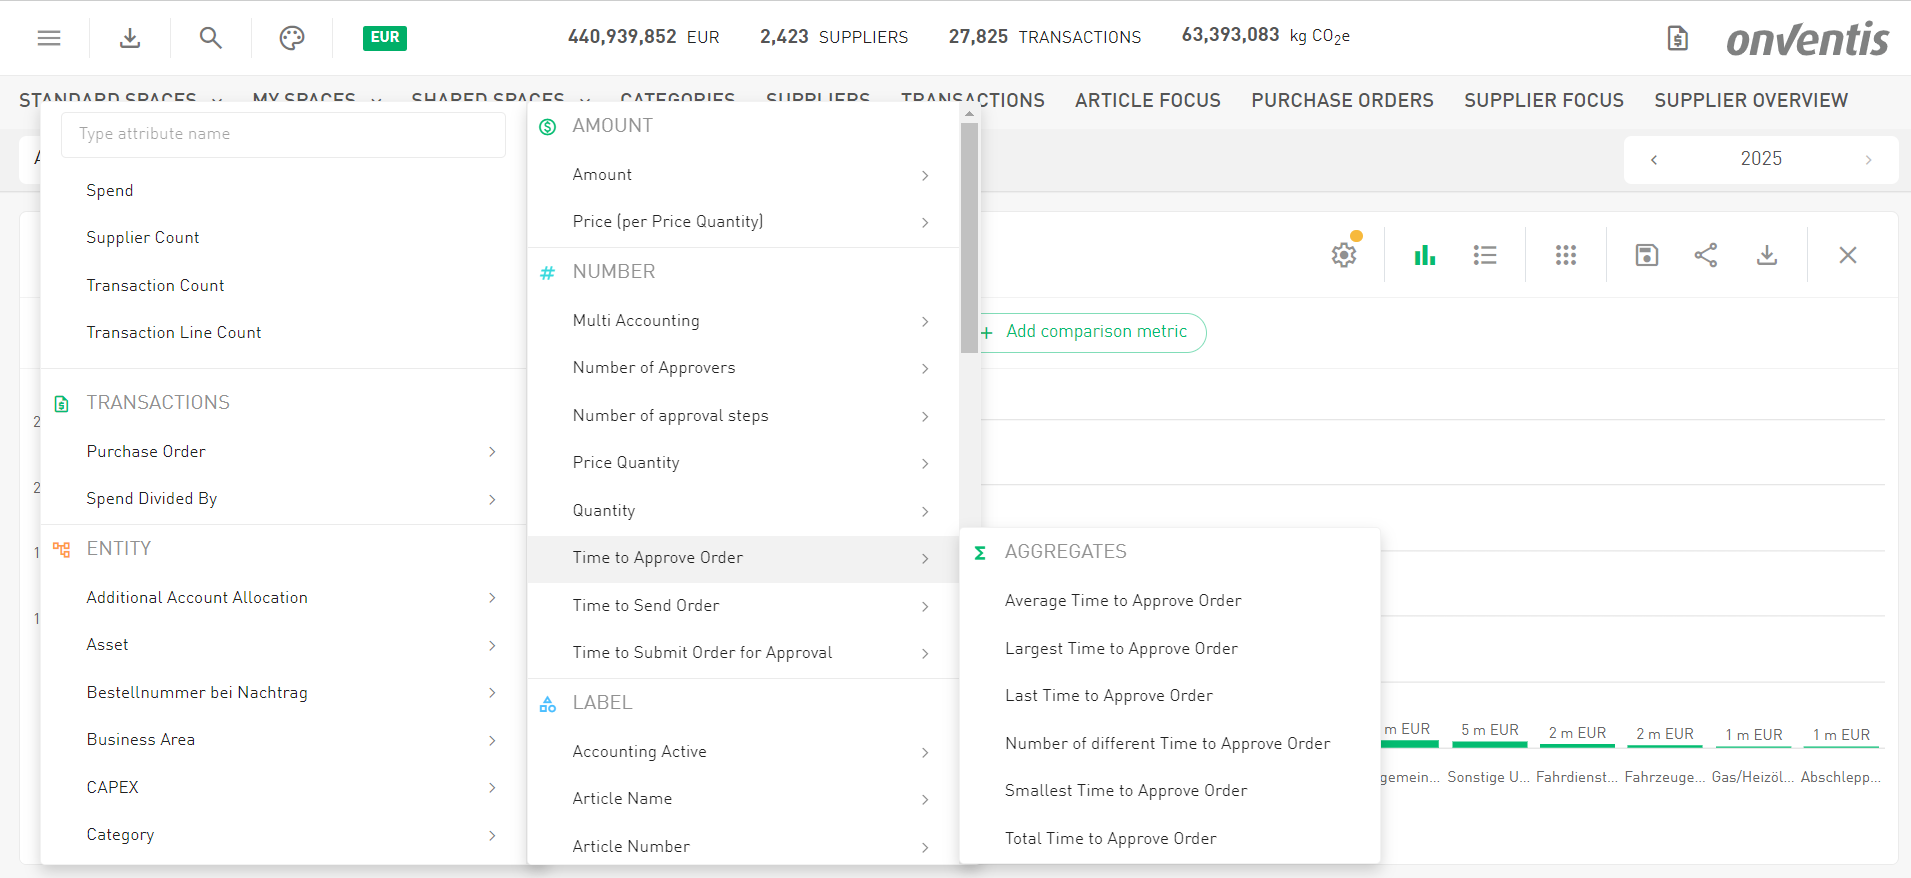
Time to Approve Order
Calculated as: Approval End Date – Approval Start Date
Example: 4 days, 15 minutes.
This metric lets you analyze the e.g. the average approval time per organizational unit, cost center, or team, giving insight into bottlenecks during the approval stage.
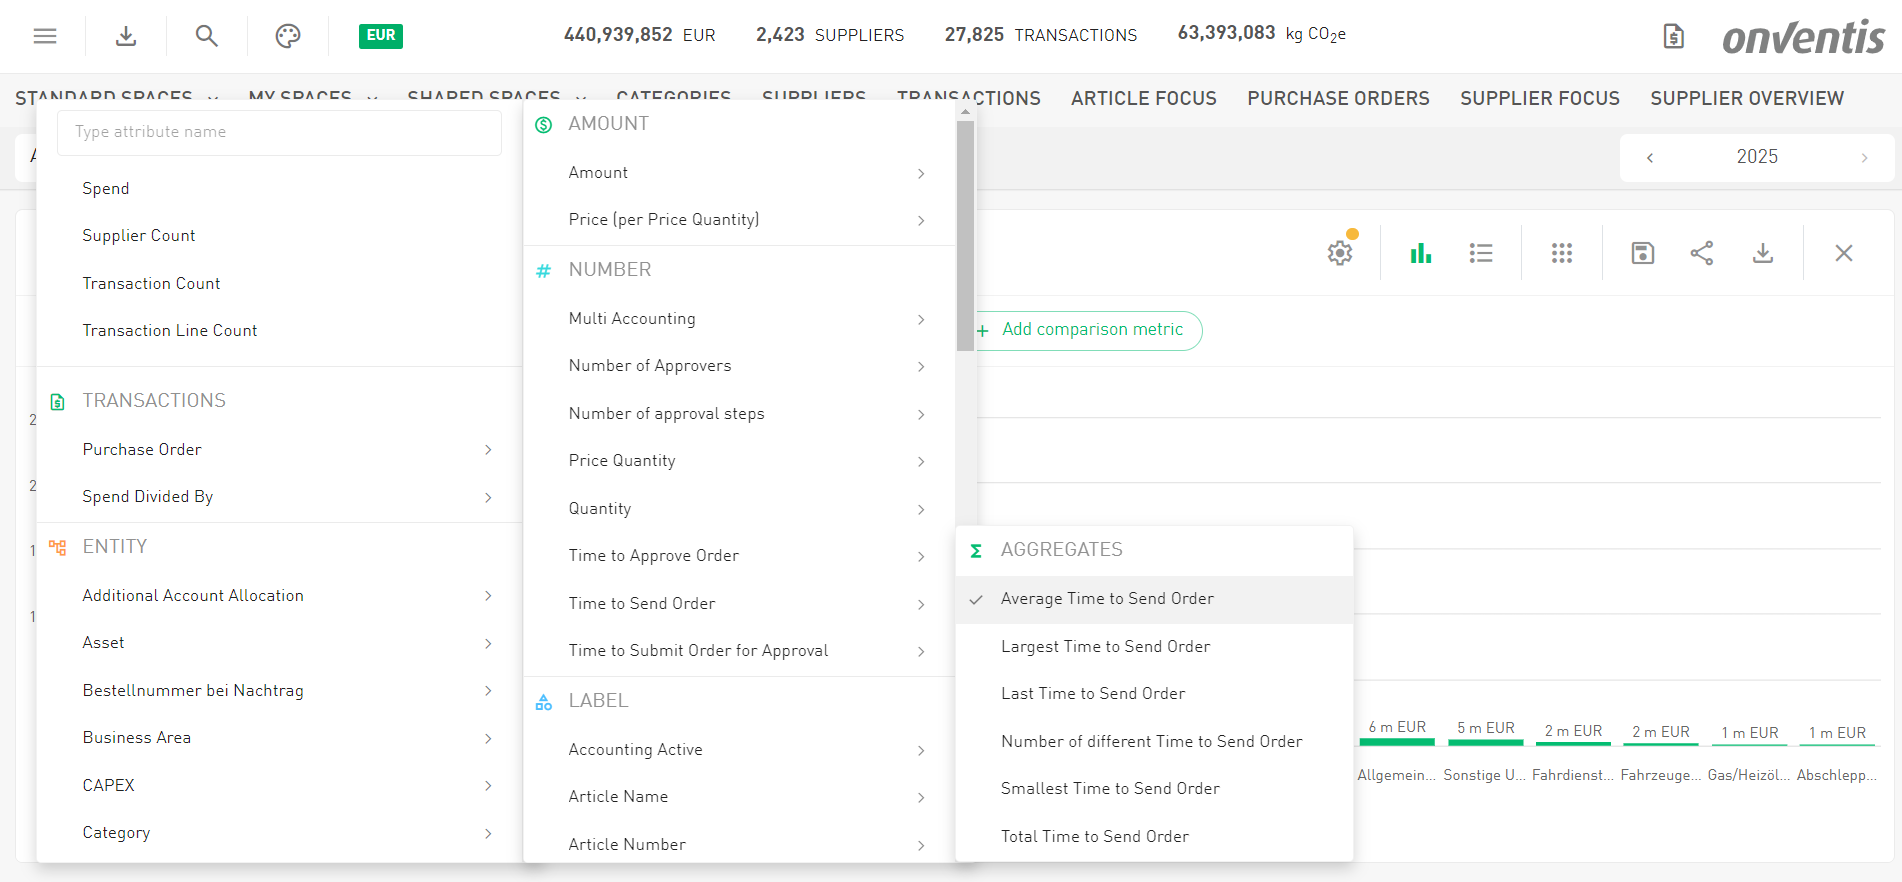
Time to Send Order
Calculated as: Order Created Date – Purchase Order Date
Now you can see how long it takes, on average, for orders to go from creation to being sent, broken down by org unit, category manager, or other relevant dimensions.
In short: you’ll now have real numbers to spot slowdowns, optimize processes, and make approvals feel less like a waiting game.
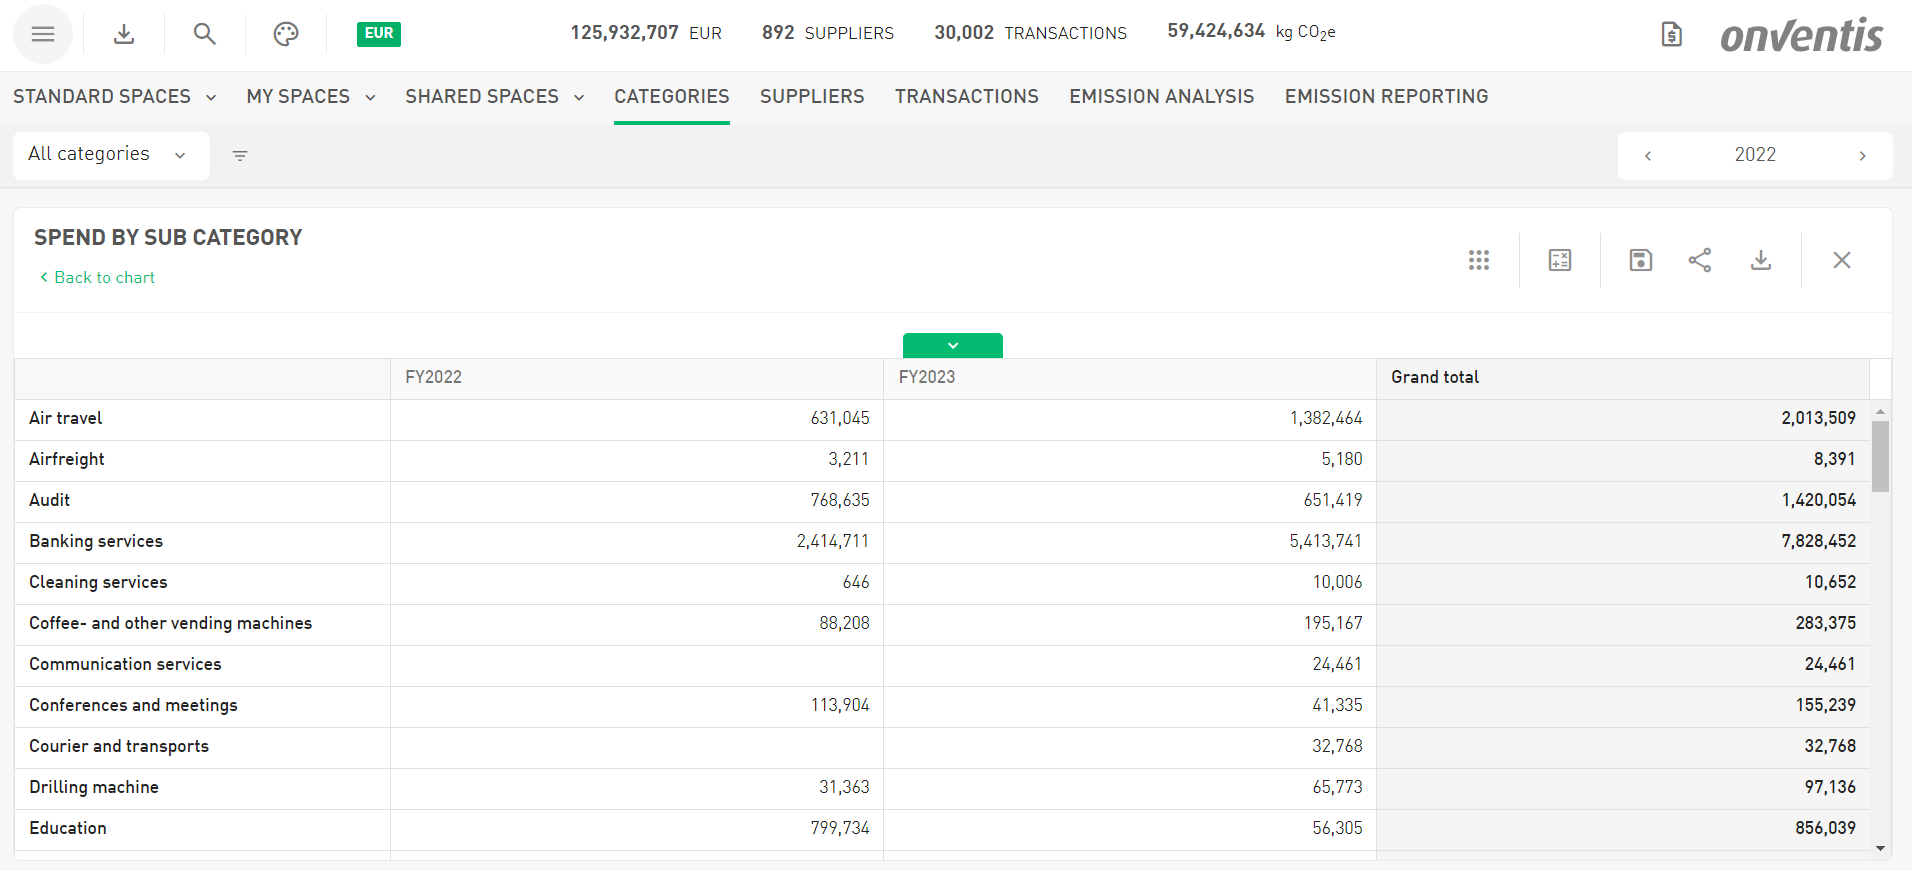
Fiscal Years: Now Named After Their Grand Finale
Fiscal years have always had a bit of an identity crisis. If a fiscal year started in 2023 but ended in 2024… was it really 2023? Technically yes—until now.
With this update, fiscal years are officially named after the year they end, not the year they begin. In other words: the year of the big accounting finale gets the spotlight.
So instead of this:
July 1, 2023 – June 30, 2024 → Fiscal Year 2023
You’ll now see this:
July 1, 2023 – June 30, 2024 → Fiscal Year 2024
Why the change? Because that’s how the grown-ups in accounting do it. Naming fiscal years after the year they close aligns with common accounting practices and regulations, including the Accounting Act, guidance from the German Federal Central Tax Office (Bundeszentralamt für Steuern), the Swedish Tax Agency, and international standards like IFRS and GAAP.
It’s also the approach widely used in Germany and many other countries—especially when fiscal years don’t match the calendar year. For example, a fiscal year running from March 2024 to February 2025 will now simply be called Fiscal Year 2025, which makes sense since the financial closing and reporting happen in 2025.
In short: fiscal years now get their name from the year they finish strong. A small change, but one that keeps things clearer—and a lot more aligned with the accounting world.
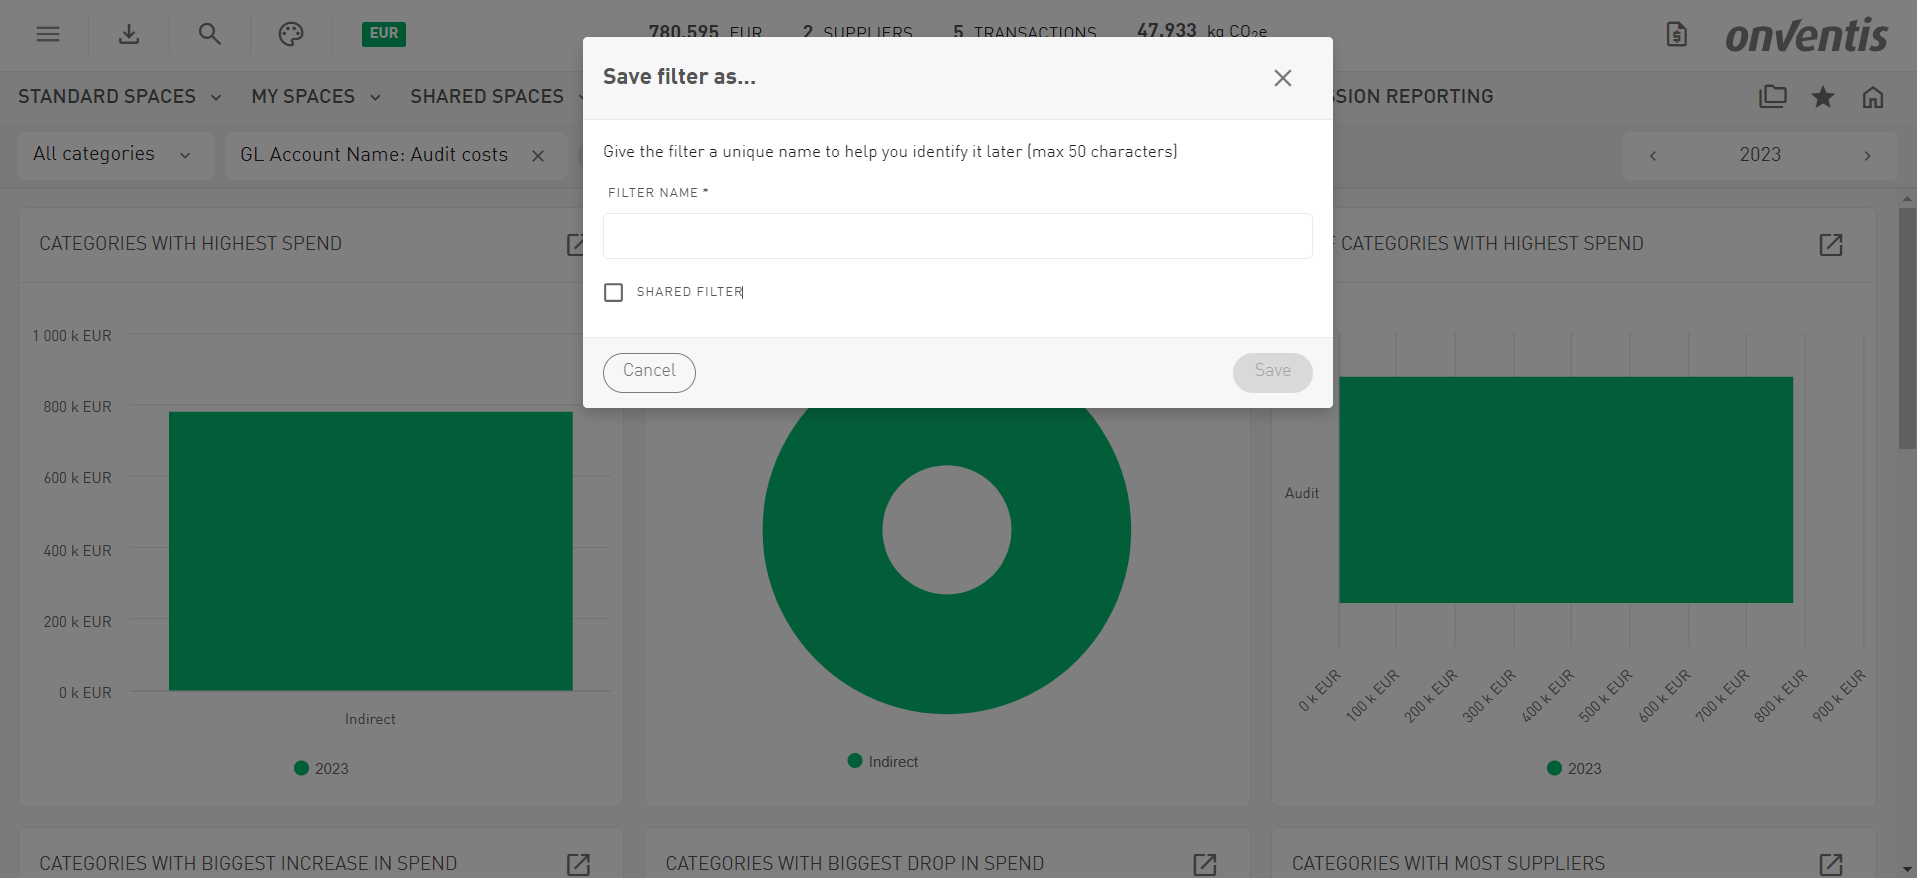
Filters Worth Sharing 🤝
Some filters are just too good to keep to yourself. From now on, you can decide whether a filter stays your little productivity secret—or becomes a gift to the entire team.
When saving a filter, you’ll now have two options: save it as “My Filter” for your personal use, or as a “Shared Filter” so others can reuse it as well. Think of it like the difference between your private workspace and the public chart area—just applied to filters.
To keep things tidy, filters are now neatly organized into two groups when you select them: My Filters and Shared Filters. That means less time rebuilding the same filter logic and more time actually analyzing your data.
Create once, reuse often—and if you’re feeling generous, share the good ones. Your colleagues will thank you.
New in Masterdata 📁
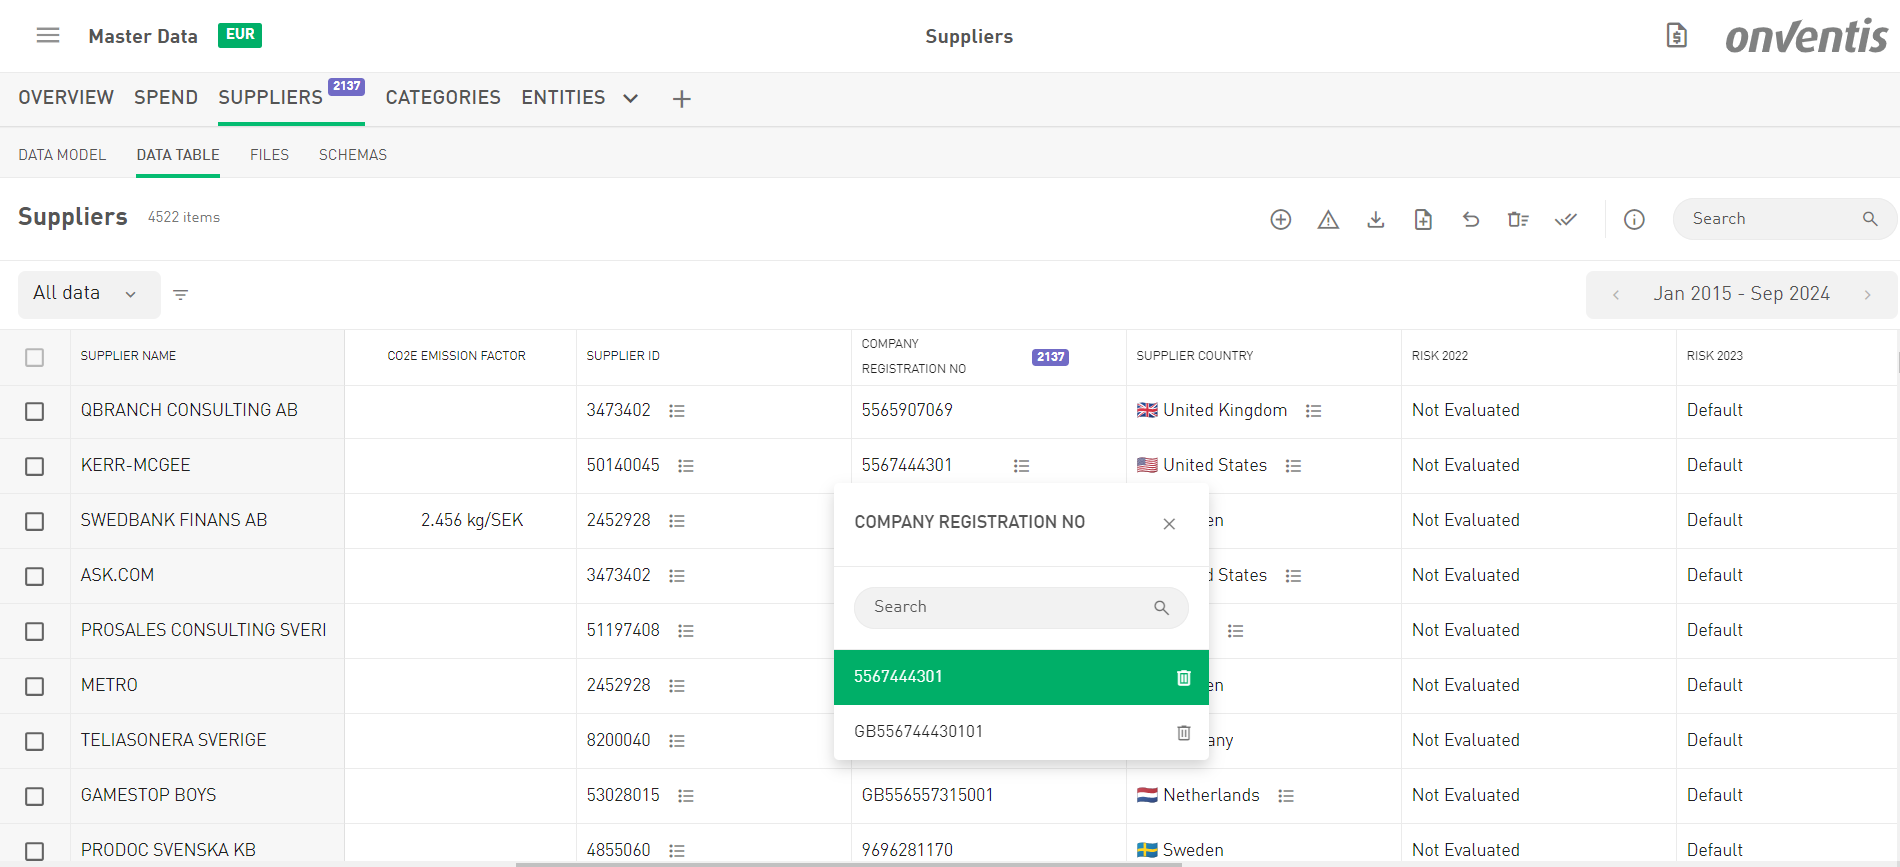
Multiple Numbers, One Clear View
Some data fields like CRNs and organization numbers can contain several values at once. Great for completeness—less great for charts. When the system had to display these fields in graphs, pivot tables, or data tables, it faced a small existential crisis: Which value should I show?
To solve this, you can now define a display value for these attributes—similar to how it already works for fields like supplier country.
This means you can select which value should represent the field when it appears in charts (group-bys), detail tables, and master data exports. The result: clear visualizations, consistent tables, and no more guessing which number the system might choose.
In short: multiple numbers can still exist behind the scenes—but when it comes to analytics, you decide which one takes center stage.
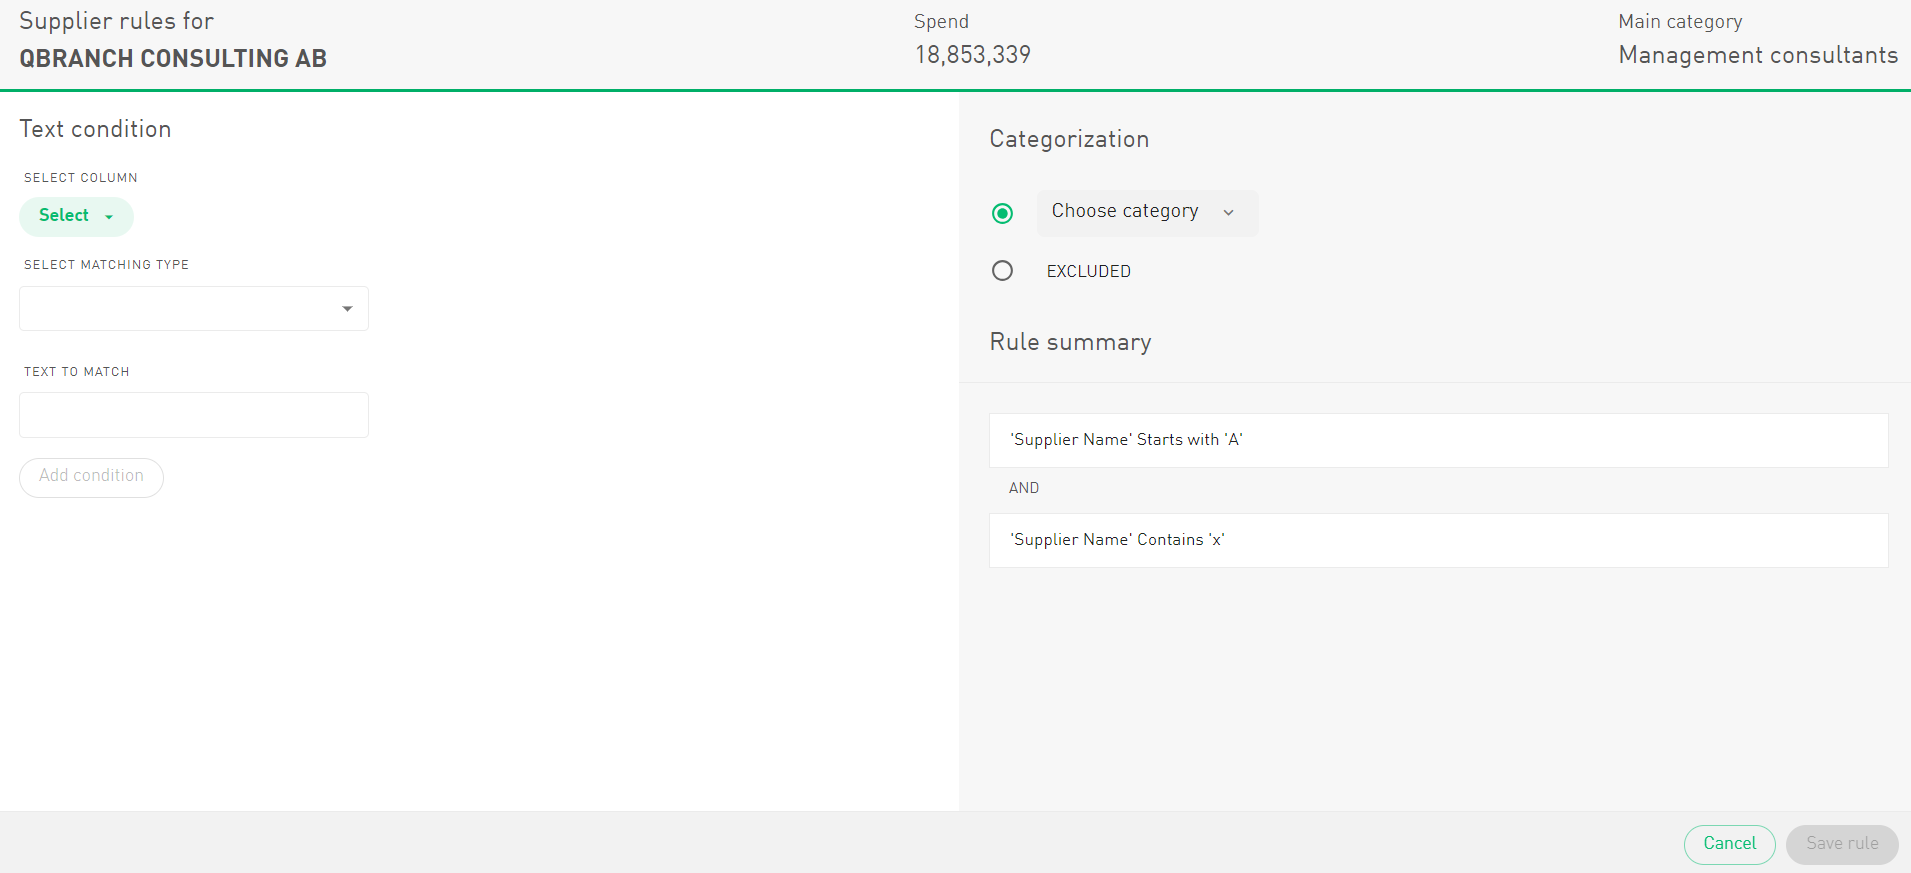
No More Guessing: Text Conditions Now Clearly Mean AND
When setting up multiple text conditions in rules, there was one small—but important—detail that wasn’t always obvious: the conditions are evaluated as an AND. In other words, all of them must be true for the rule to apply.
Previously, the rule summary in the UI didn’t make this entirely clear, which occasionally led to a bit of head-scratching when rules behaved differently than expected.
With this update, we’ve improved the rule summary display so it clearly shows that multiple text conditions are combined with AND logic.
The result? Fewer surprises, clearer rules, and a much easier time understanding exactly why a rule is triggered.
Because when it comes to rule logic, a little clarity goes a long way.
Other news🖌️
Showing the Right Contract ID 🔎
Until now, we displayed the internal contract ID from TendSign, which works great for the system itself… but not so great for humans trying to reconcile contracts across systems.
With this update, we now retrieve and display the Reference Number from TendSign instead. This is the customer’s actual contract number—the one people recognize and use in real life.
Here’s what changes:
Reference Number → now displayed in the contract module (the customer’s real contract number)
Contract ID → TendSign’s internal ID, still used in the URL for linking, but no longer shown as the visible contract identifier
The result: contracts in the contract module now match the numbers in your spend files and internal documentation, making reconciliation a lot less detective work.
A Fresh Coat of UI Paint (and a Better Engine Under the Hood)
Behind the scenes, we’ve given our interface a major upgrade by moving our UI components to Material UI (MUI). MUI is a widely used React component framework that follows Material Design principles and provides a robust, modern foundation for building consistent and responsive user interfaces.
What does that mean for you?
First, the interface becomes more consistent and responsive, because MUI’s components are optimized and widely battle-tested. Second, it allows us to develop and adjust UI elements more efficiently, which means improvements and refinements can happen faster. And finally, the new component framework helps reduce visual glitches and improves overall rendering performance.
You might not notice a dramatic visual change everywhere—but under the hood, the UI is now running on a much more modern and reliable foundation. Think of it as swapping the engine of a car: it may look familiar on the outside, but the ride is smoother and faster.