
Onventis Analytics 2025.4
Welcome to Onventis Analytics 2025.4!
This release marks a major step toward truly intelligent procurement. With AI Strategies, spend analysis moves from hindsight to foresight — turning your data into tailored, goal-driven category strategies that actually do the thinking with you. Powered by large language model intelligence, it connects your spend patterns with business goals like cost reduction, supply stability, and sustainability, creating strategies that are as actionable as they are insightful.
It’s a smarter, more connected way to shape category management — one that learns from your data and helps you stay a few moves ahead.
Curious how it works? Check out the release notes to see what AI Strategies can do for your organization.
2025.4 Release date:
New in AI ✨
💡 AI Strategies – From Spend Analysis to Strategic Impact
Procurement just got a lot smarter.
The new AI Strategies feature empowers teams to move beyond reporting and start shaping the future — with intelligent, data-driven category strategies powered by large language model (LLM) intelligence.
By combining your company’s spend data with best-practice insights, AI Strategies delivers tailored, goal-oriented strategies for each category — whether your focus is cost reduction, supplier consolidation, quality improvement, or sustainability. Users can dive deeper into any recommendation, regenerate specific points for more context, and even turn strategies directly into procurement policies to ensure consistent execution.
And the best part is the key analytical findings per category, uncovering hidden spend dynamics like supplier dependencies, outliers, and seasonal trends.
👉 Interested in unlocking AI Strategies?
Contact our sales team to learn how your organization can bring strategic, AI-driven decision-making into procurement.
This is how the magic happens:
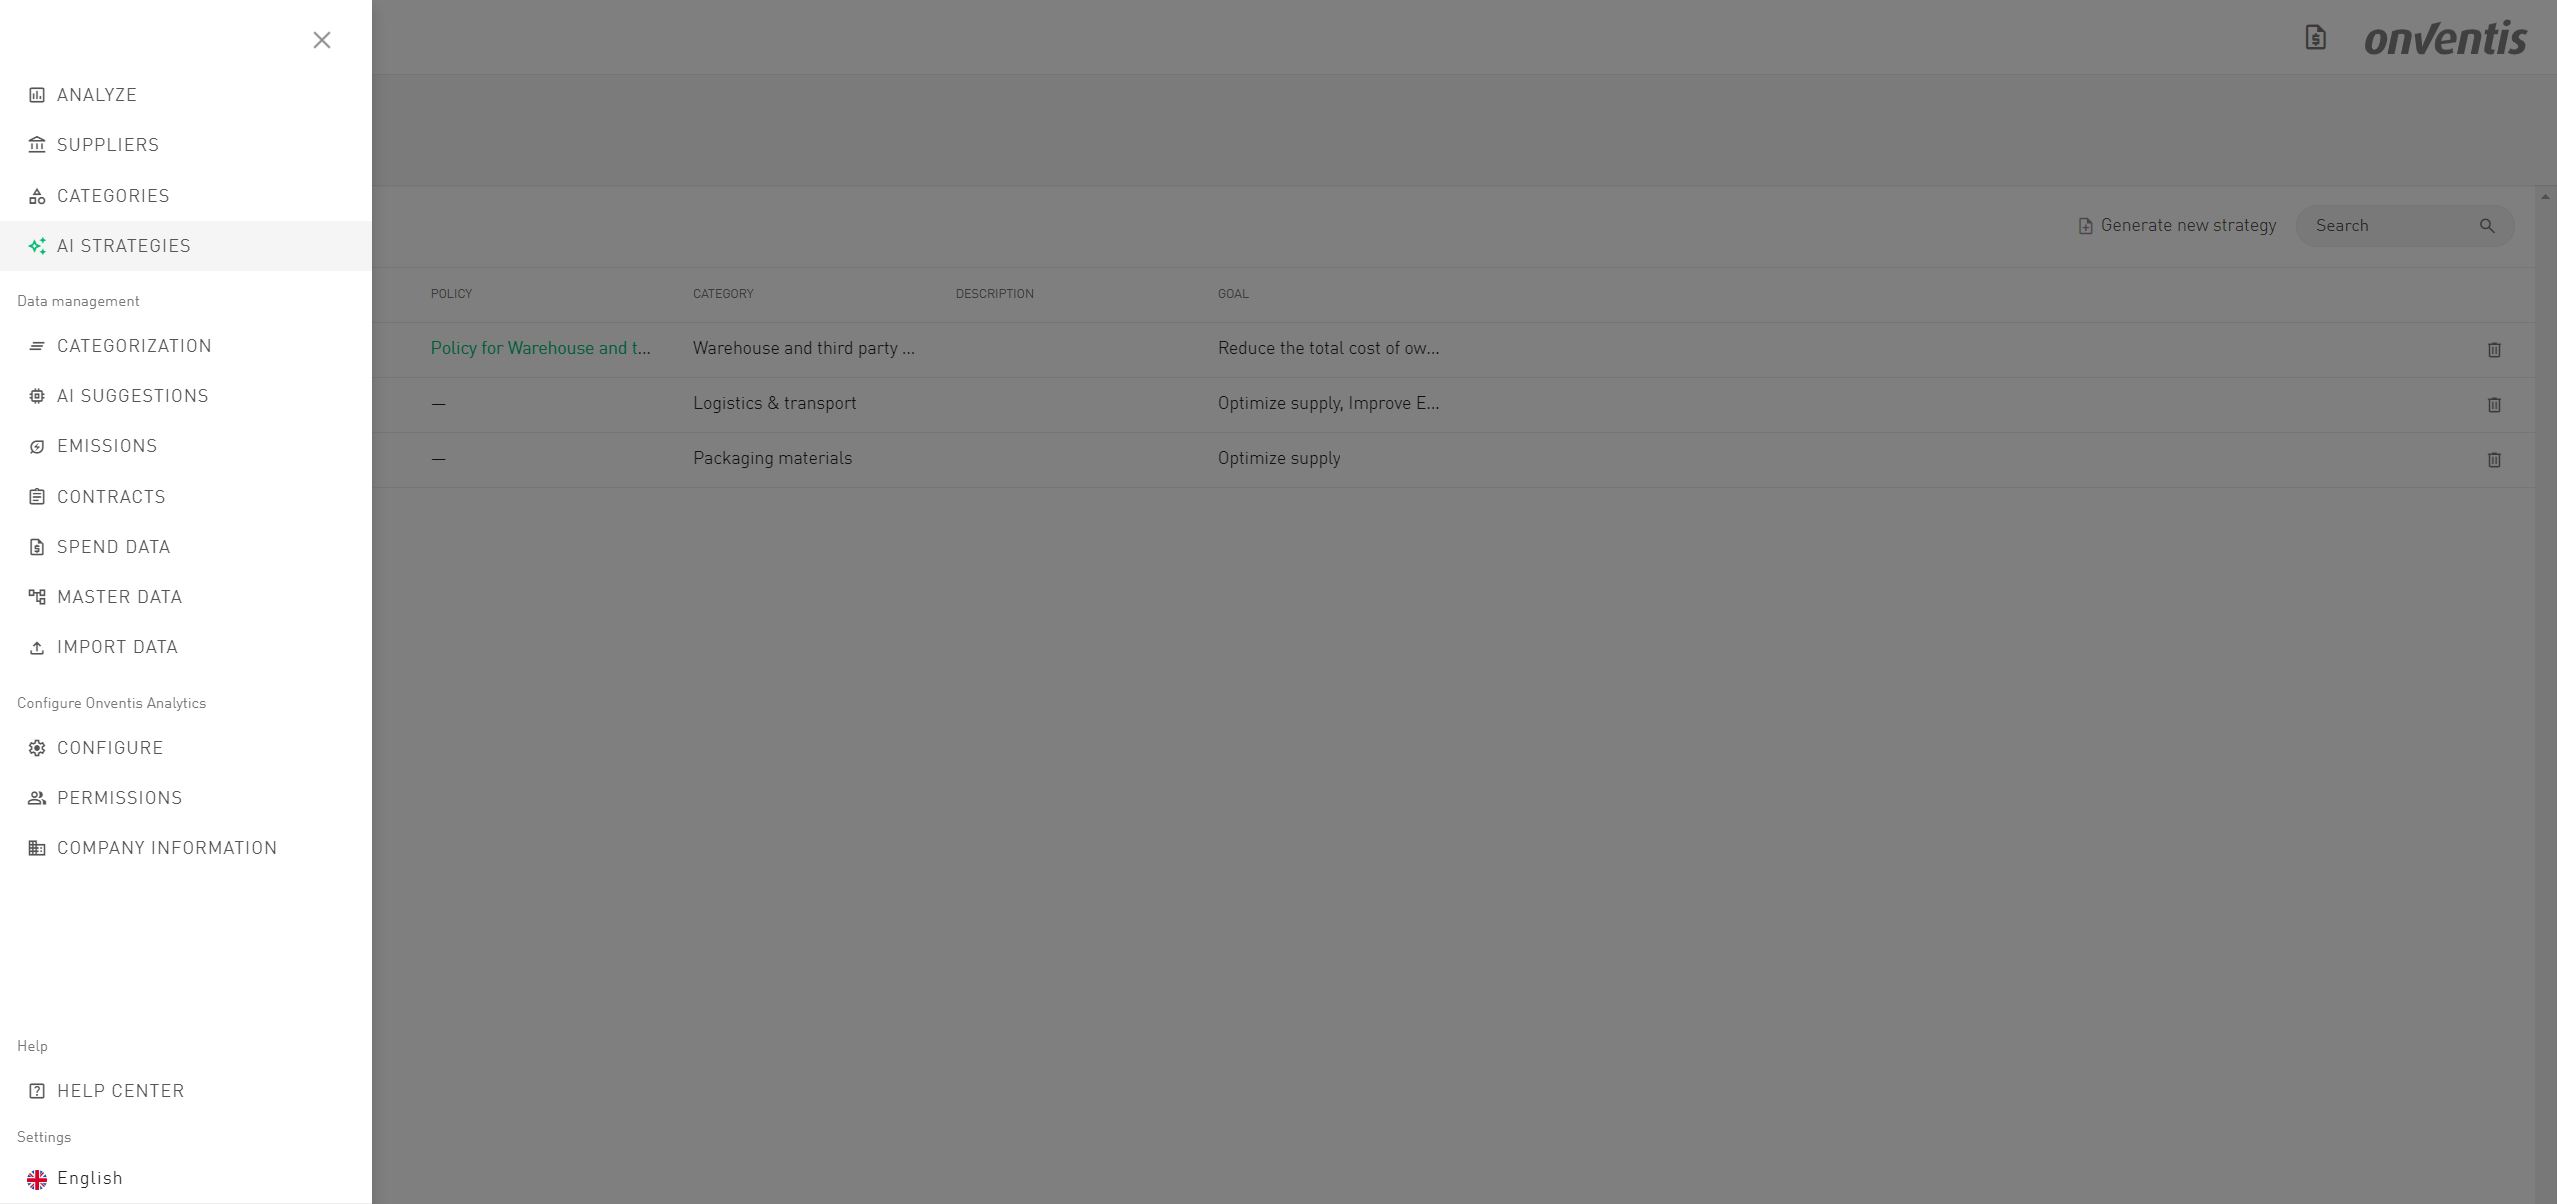
To create a strategy, simply open AI Strategies menu item and click “Generate a new strategy.”
If your company information hasn’t been filled in yet, you’ll see a friendly orange reminder. Adding these details helps the AI understand your context — and leads to noticeably sharper, more relevant strategies. So yes, it’s worth the minute.
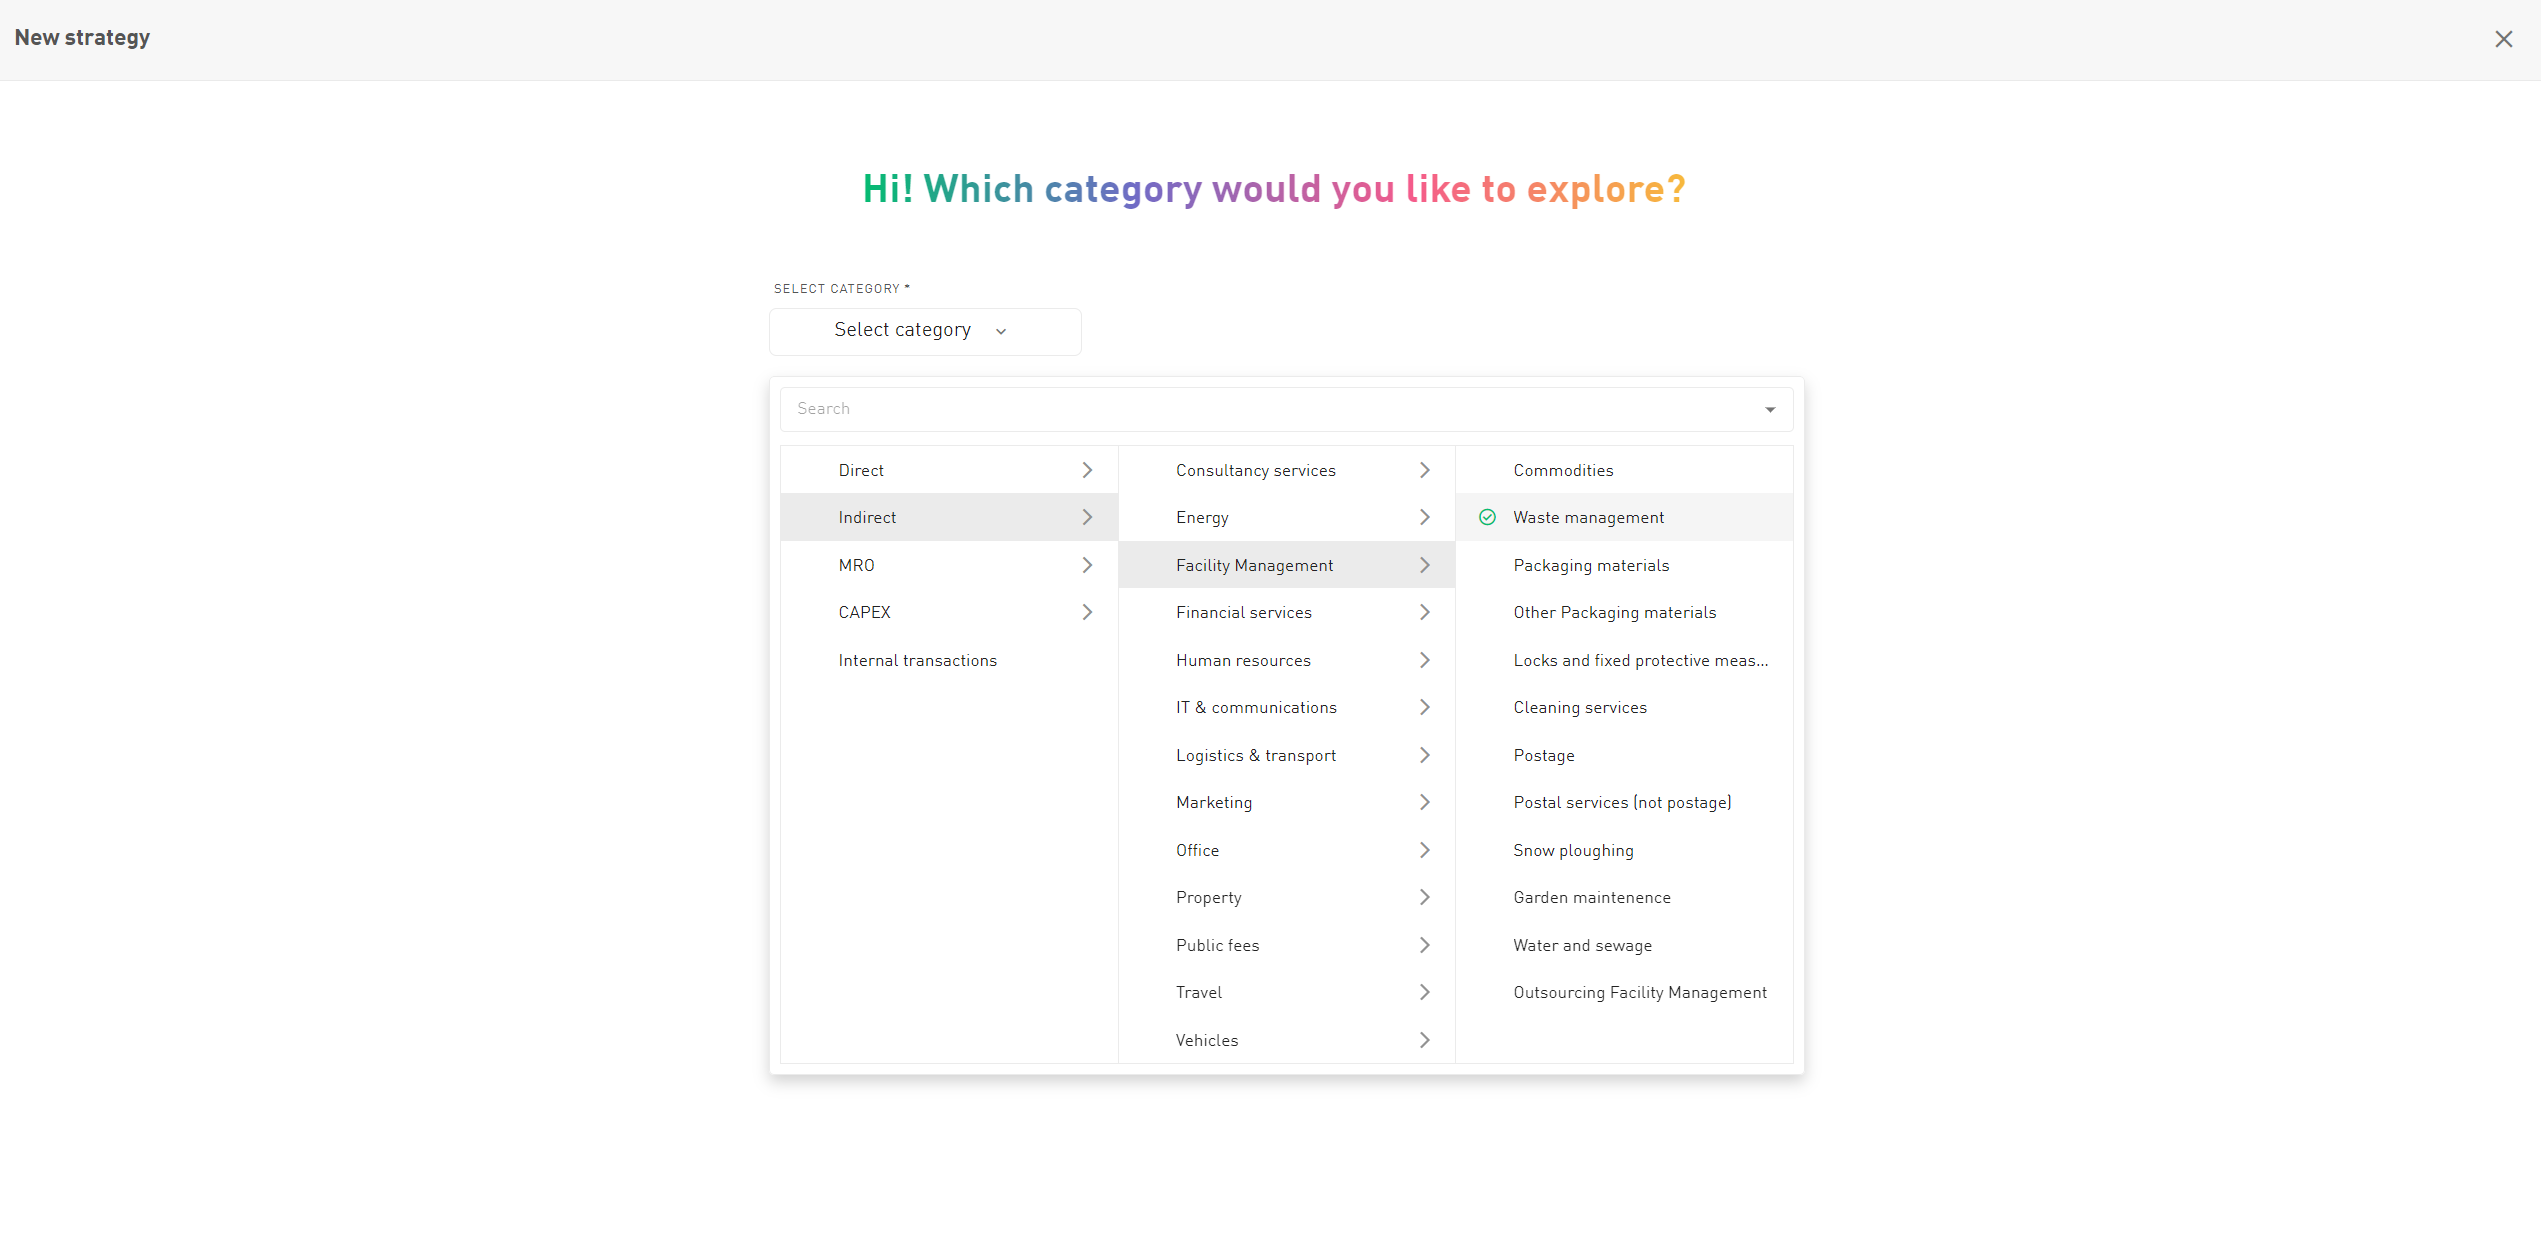
Once your company profile is complete, the first step is to select the category you want the strategy for. You can pick any category from the hierarchy, whether it’s a broad parent category or a very specific leaf category. Choosing a more granular (leaf) category allows the AI to focus on the precise spend, suppliers, and patterns within that segment, resulting in a strategy that’s far more actionable and tailored to your exact needs.
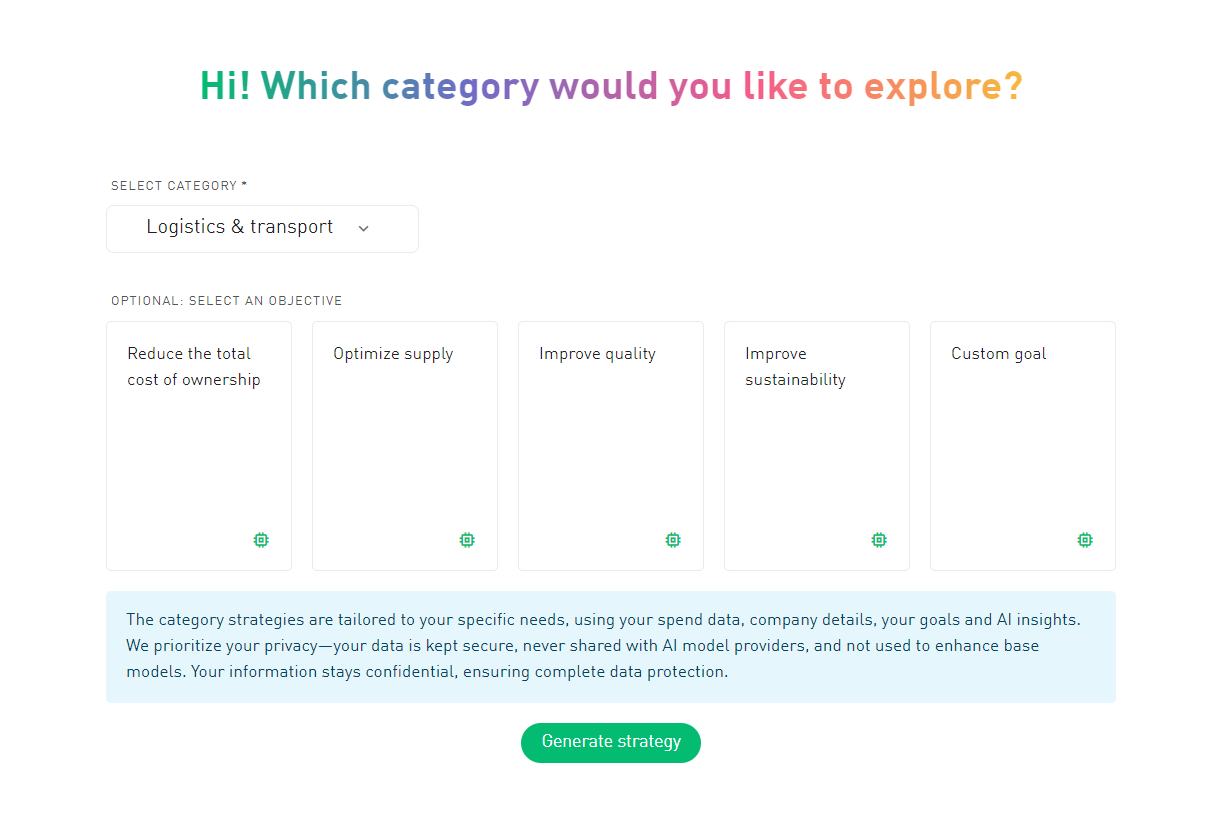
The second step is optional: selecting a goal for your strategy. We provide five predefined goals — Reduce Total Cost of Ownership, Optimize Supply, Improve Quality, Improve Sustainability, and Increase Supplier Innovation — as a starting point. These are suggestions to guide the AI, but you’re free to define a custom goal to tailor the strategy to your unique objectives. For example, you might create a goal to boost regional sourcing, increase supplier diversity, or drive faster time-to-market.
You are also free to use multiple objectives at once, allowing the AI to generate a strategy that balances several priorities simultaneously.
Once you click “Generate Strategy,” the AI gets to work creating your tailored recommendation. The strategy is based on your company’s spend data — the more comprehensive the data, the more precise and actionable the resulting strategy will be.
Because larger datasets require more processing, generation can take a few minutes. Don’t worry — it runs as a background job, so you’re free to navigate away and return later to see the completed strategy. On the overview page, you can also monitor the status of all your strategies and check whether any are still being generated.
Once the strategy is ready, you can request more detailed information for any individual bullet point. Simply click “Regenerate Bullet Point” to expand on a recommendation. The regeneration process takes a few moments, after which you can decide whether to accept the updated bullet point, regenerate it again for a different perspective, or cancel it entirely. This gives you full control to refine each recommendation and ensure it aligns perfectly with your business objectives.
Once you’re happy with a strategy, you can copy it or download it as a PDF for easy sharing or documentation. You can also turn the strategy into a policy with a single click — and, just like strategies, policies can be downloaded as PDFs. Each policy remains linked to its original strategy in the overview table, so you can always trace back how a policy was created and ensure strategic consistency across your categories.
The name of each strategy and policy is generated automatically based on the selected category and goal but can be renamed anytime in the respective overview. Adding clear, descriptive names helps keep your strategies organized — especially when managing multiple categories or business objectives.
In the strategy and policy overview, you can also add a short description to summarize key points, sort entries by creation date, or delete outdated drafts. This makes it easy to maintain a clean and structured workspace, even as your library of strategies grows.
All strategies and policies are visible not only on the AI Strategies page but also directly on the corresponding category pages under the “Strategies” and “Policies” tabs. This allows you to instantly see which categories already have strategies in place, compare approaches across spend areas, and navigate seamlessly between related insights.
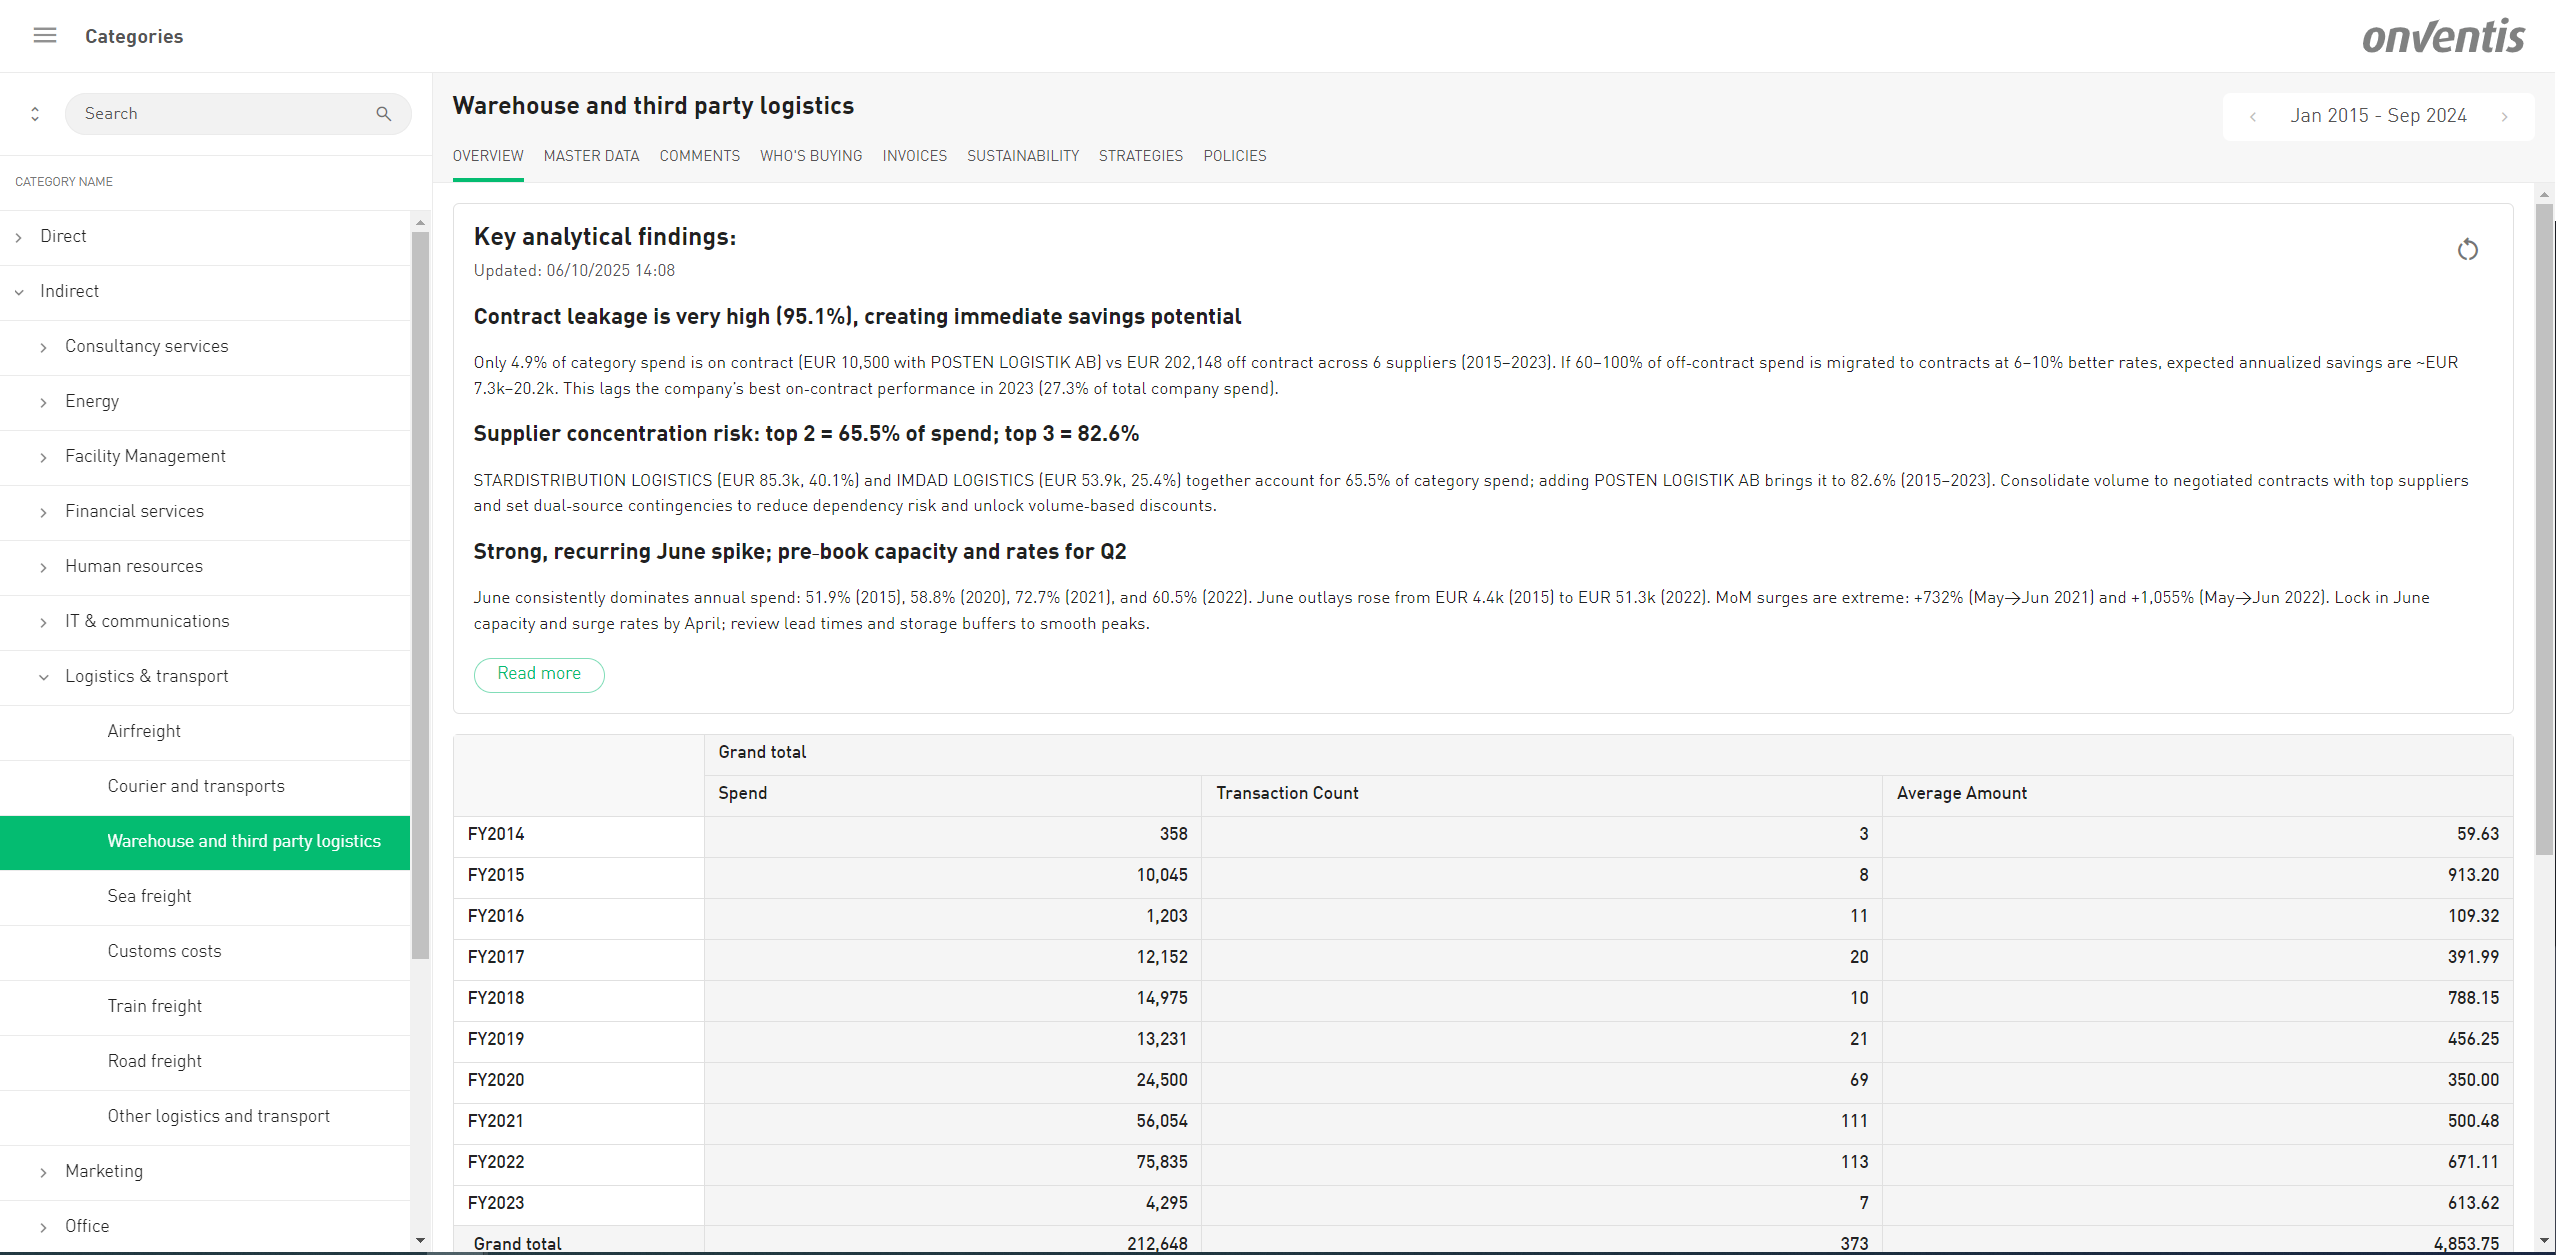
A core part of AI Strategies is the inclusion of key analytical findings for each category. These findings summarize the most relevant data insights — such as seasonality, supplier concentration, contract leakage, spending patterns, or outliers — and help users instantly understand the underlying spend dynamics without manual analysis.
Each finding highlights potential opportunities or risks that can inform the strategy. For example, the system might detect:
High contract leakage (e.g., 95.1% off-contract spend) indicating immediate savings potential by consolidating spend under negotiated agreements.
Supplier concentration risks, such as 80% of spend tied to only three suppliers, prompting diversification or dual-sourcing actions.
Strong seasonal peaks, like recurring June spikes in logistics costs, suggesting early capacity booking to avoid surge rates.
Data anomalies or structural changes, such as a sudden 94% spend drop year over year, flagging possible data gaps or shifts in sourcing behavior.
Sustainability insights, including emissions intensity per euro spent, highlighting where decarbonization efforts will have the biggest impact.
Findings like these translate raw spend data into clear, actionable intelligence — helping procurement teams spot inefficiencies, manage risks, and prioritize improvement areas before they become issues.
Users can regenerate analytical findings at any time to refresh the insights based on updated spend data. Each finding also displays the timestamp of its last generation, ensuring full transparency about data freshness and reliability.
❗ Please note:
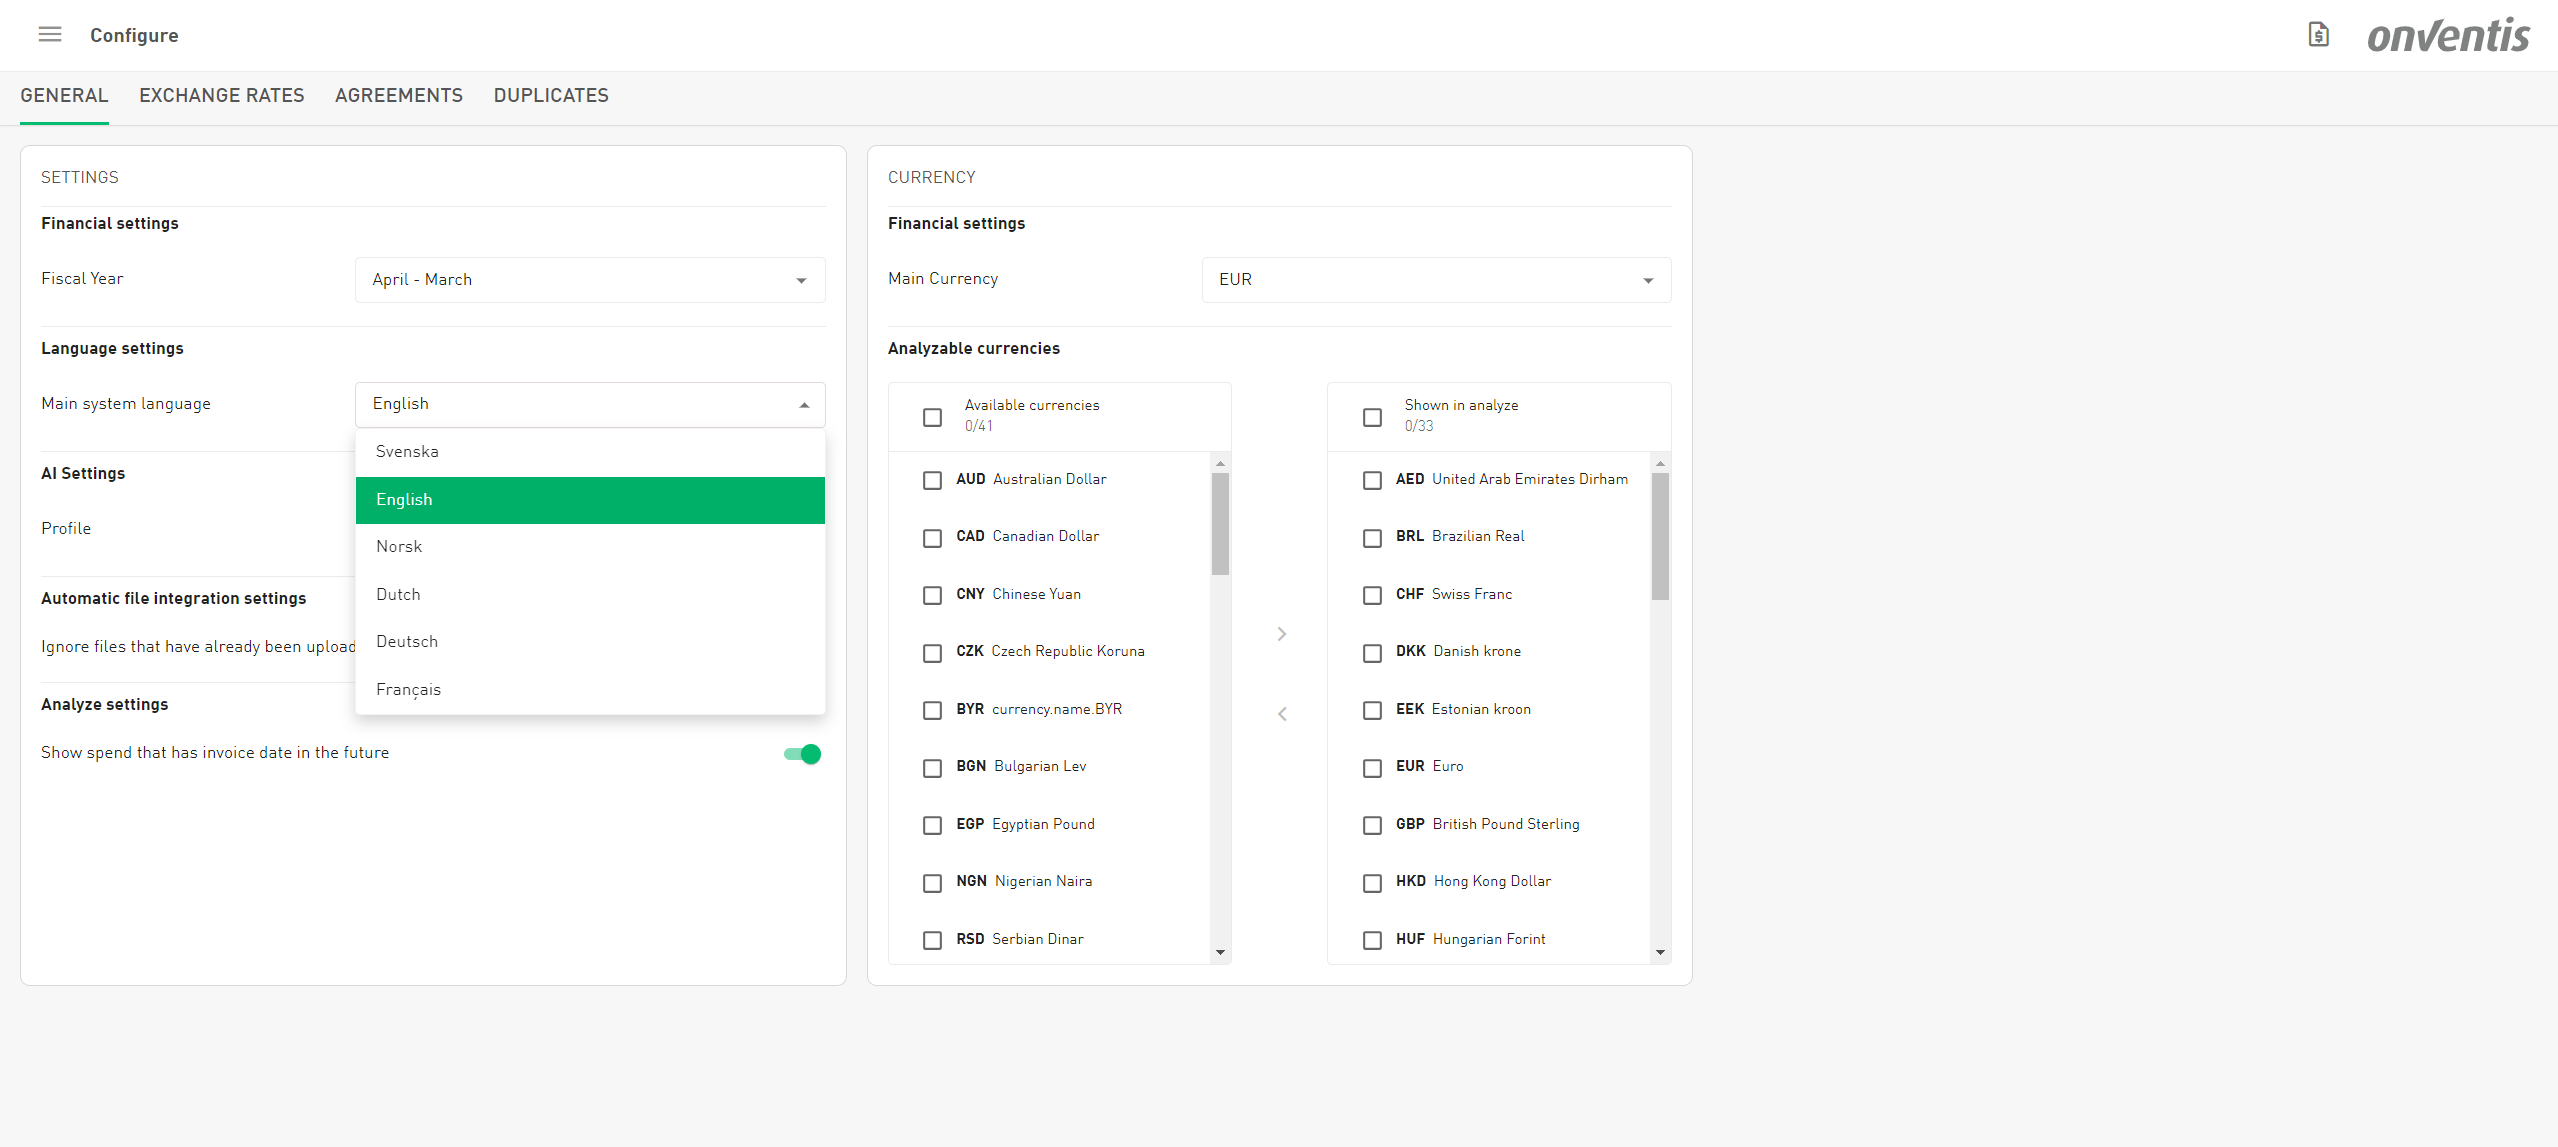
Strategies, policies, and key analytical findings are generated in your company’s main system language. By default, this is German when Analytics it is used based on the Onventis Buyer Data Model, and English when it is not. You can adjust the main system language at any time on the Configuration page.
However, content that has already been generated — including existing strategies and policies — will remain in the language they were originally created in and won’t be automatically translated after a language change.
New in Analyze 📊
🎨 Smooth and Steady: Chart Movement Refined
Ever tried to rearrange your dashboard and ended up playing accidental Tetris with your charts? We know the feeling — one small drag and suddenly your perfectly arranged layout looked like modern art.
Not anymore.
From now on, charts will stay exactly where you want them. Drag one to a new spot, and the others will politely stay put instead of running off to new positions. Editing your dashboard is now predictable, smooth, and just a little bit satisfying.
Your dashboards. Your rules. No more chart chaos.
🤝 Save It, Share It, Filter Faster
Filtering just got smarter — and more collaborative.
You can now save filters as private or public, just like you do with spaces. Private filters stay yours, while public filters can be reused by your colleagues to save time and keep everyone aligned. Less re-filtering, more insights.