Onventis Analytics 2025.3
Welcome to Onventis Analytics 2025.3!
This release is all about giving you sharper visibility, smoother analysis, and more control — whether you're analyzing data or managing who gets to see it. External spend insights now appear right inside the supplier profile, unlocking a more complete view of your supplier landscape. Viewers get new powers too, with the ability to build pivot tables without needing extra permissions.
On top of that, we’ve made it easier to preview and switch components as you build dashboards — and gave permission management a well-deserved upgrade, so configuring access feels faster, clearer, and way less clunky.
Here’s what’s new:
2025.3 Release date:
New in Analyze 📊
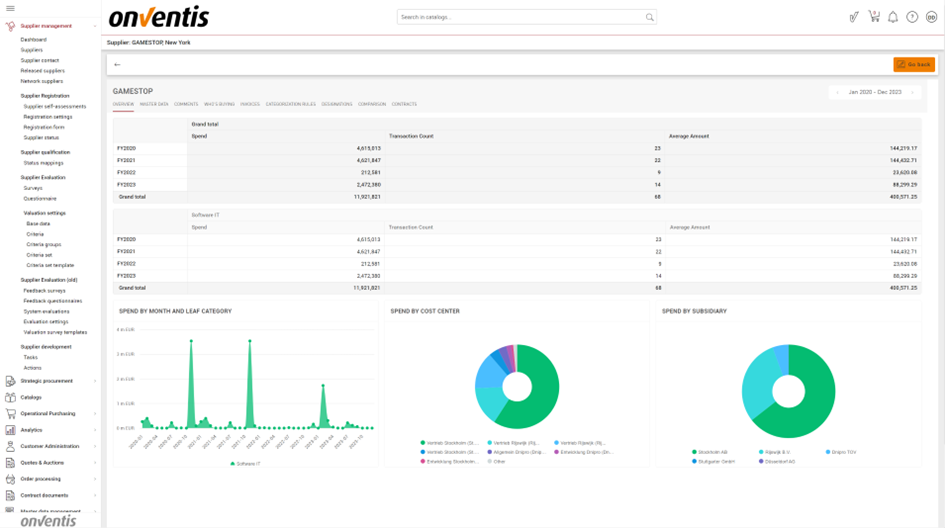
🔍 Smarter Supplier Insights — Now with External Spend!
Our embedded Analytics Widgets in the Supplier Management module just got a serious upgrade! From now on, you’ll see external spend data (e.g. from invoices outside of Onventis Buyer) directly within the supplier profile — as long as the supplier name matches.
Why this matters? Because now you get the full picture:
You can instantly spot spend activities from beyond your procurement system, giving you deeper insights, more transparency, and better supplier decisions — all without switching tools.
And yes, our AI-driven widgets are doing the heavy lifting behind the scenes — making Supplier Management not just smarter, but strategically insightful. 👀✨
🧩 More Power to the Viewer!
Users with the "Viewer" role can now configure pivot tables — a feature that was previously off-limits.
This means even read-only users can slice, dice, and personalize data views to their needs without needing elevated permissions.
More flexibility, better insights — without compromising on access control. 💡🔓
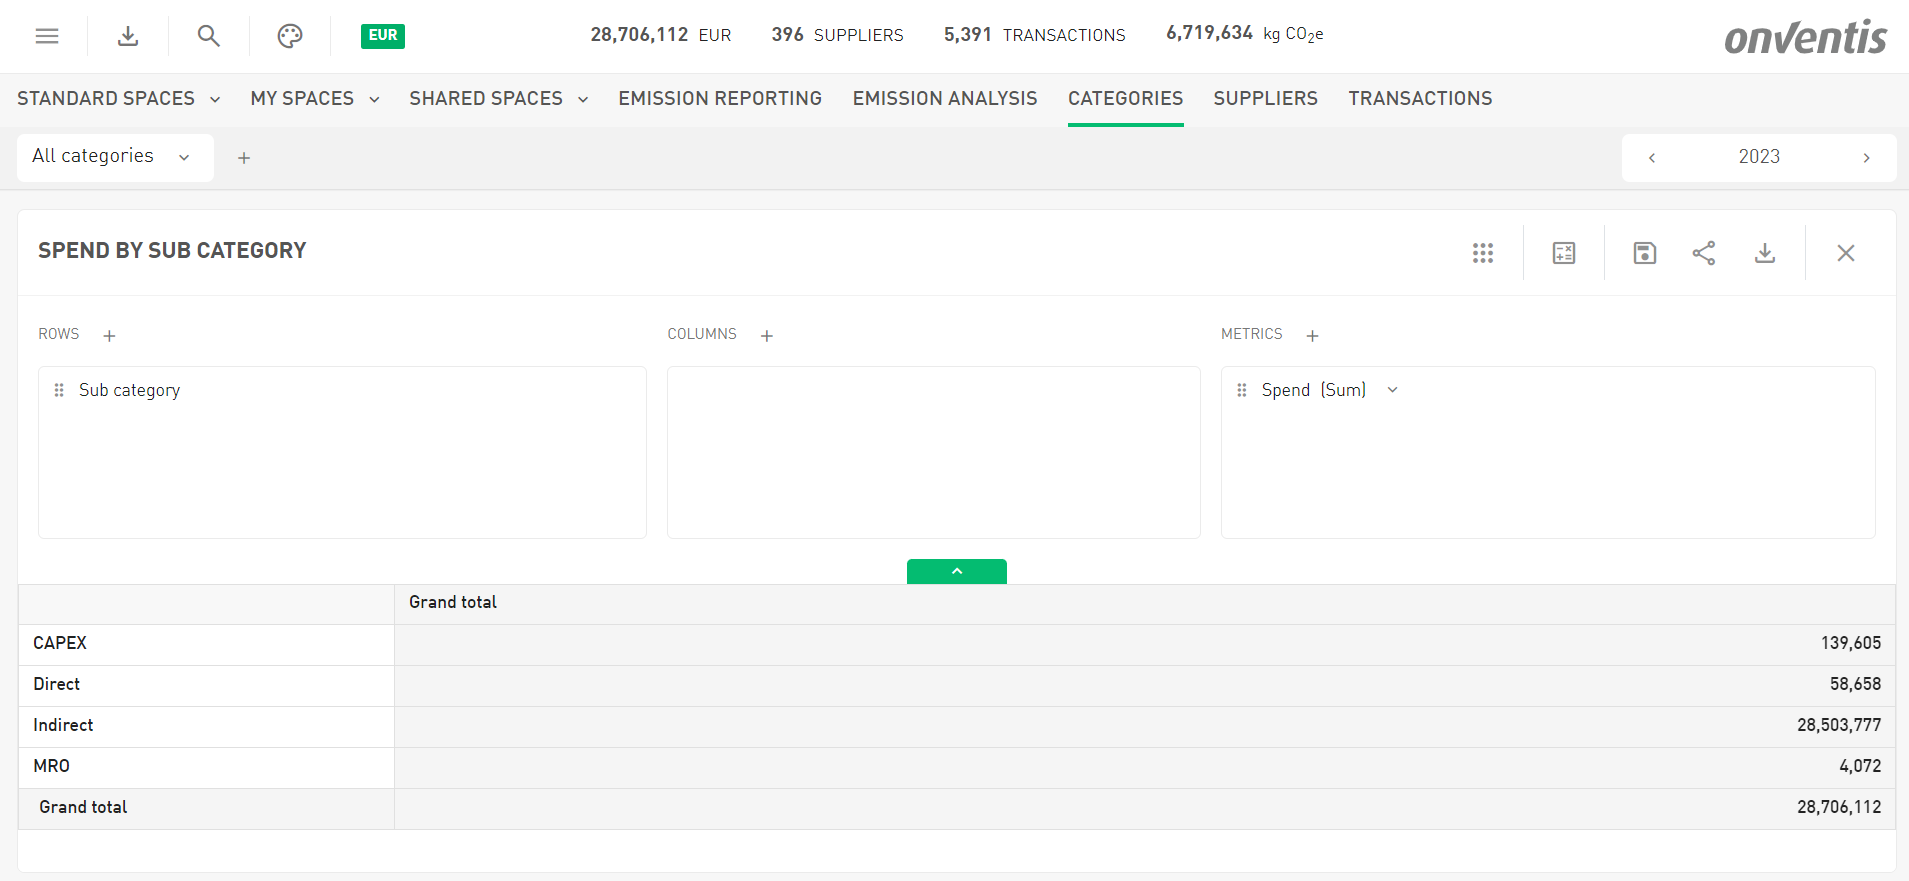
🧮 Clearer Previews for KPI Box, Data Grid & Pivot Table Configuration
We’ve made it easier to see what you’re building: the preview for KPI Boxes, Data Grids, and Pivot Tables is no longer hidden behind a tiny cogwheel!
Instead, it now lives in a clean, user-friendly expansion panel — so you can show or hide it with a click, right where you’re working.
Same helpful preview, now much more visible, accessible, and intuitive. 👀🛠️
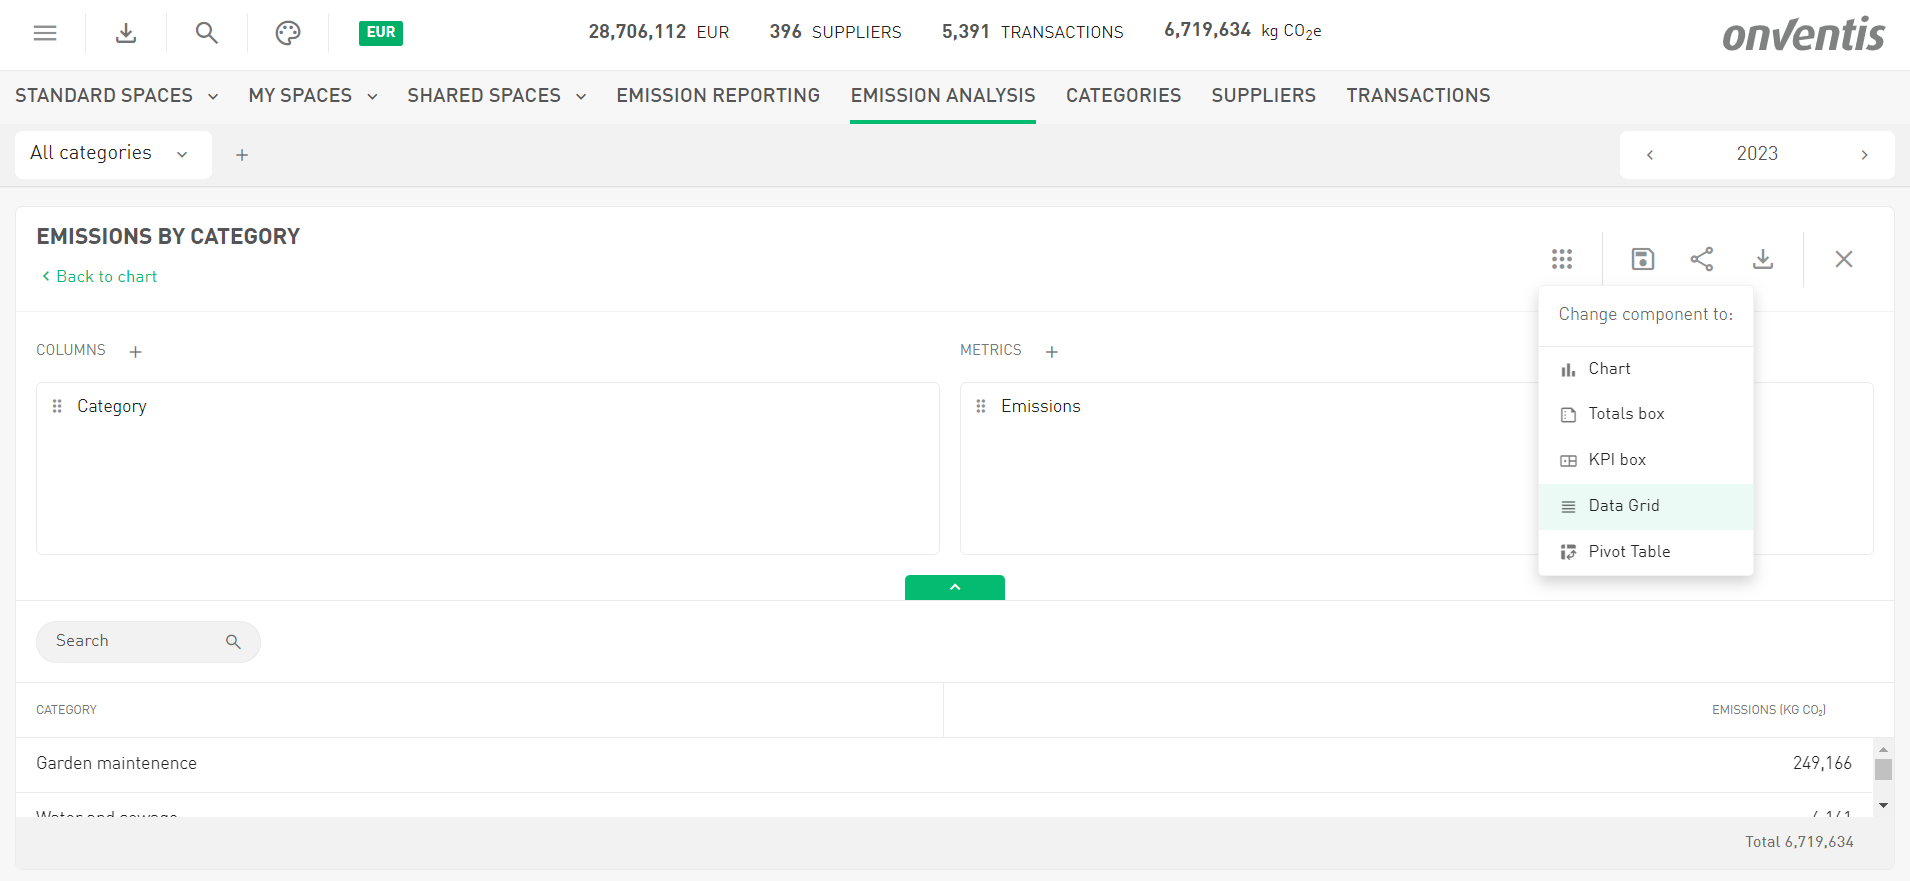
🔄 Smarter Component Switching
We’ve expanded the “Switch Component” button to work not just for charts, but now also for table-based components like Pivot Tables and Data Grids.
This means you can now easily switch from a Pivot Table or Data Grid to a KPI Box, chart, or other component — reusing your configuration as much as possible.
Note: switching back from a KPI Box or a Totals Box to another component is not supported (yet!)
New in Permissions 📊
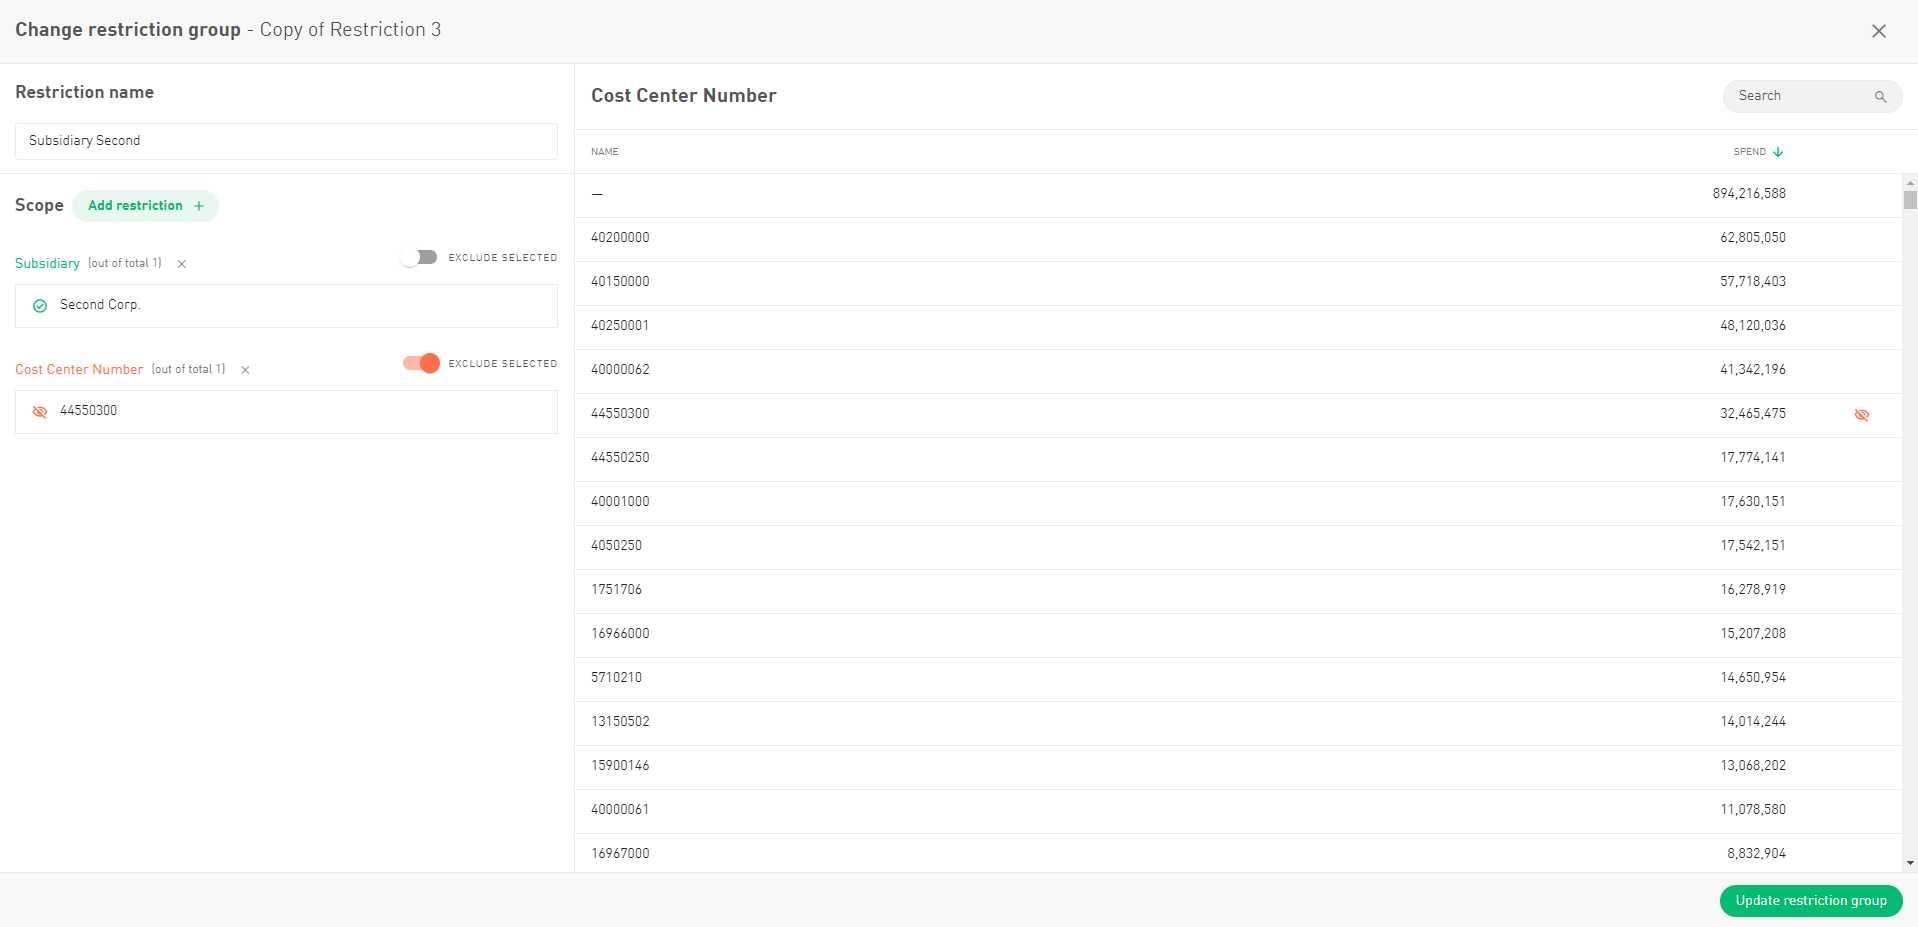
🎨 Restriction groups got a makeover
Managing who sees what just got a whole lot smoother. On the Permissions page, Admin users can continue to control access to sensitive data — like specific suppliers, cost centers, or other key fields.
What’s new? The whole process of setting up restriction groups and assigning them to users has received a much-needed makeover.
It's now more intuitive, user-friendly, and visually clear — so managing permissions feels less like a puzzle and more like a breeze. 🧩➡️✅