
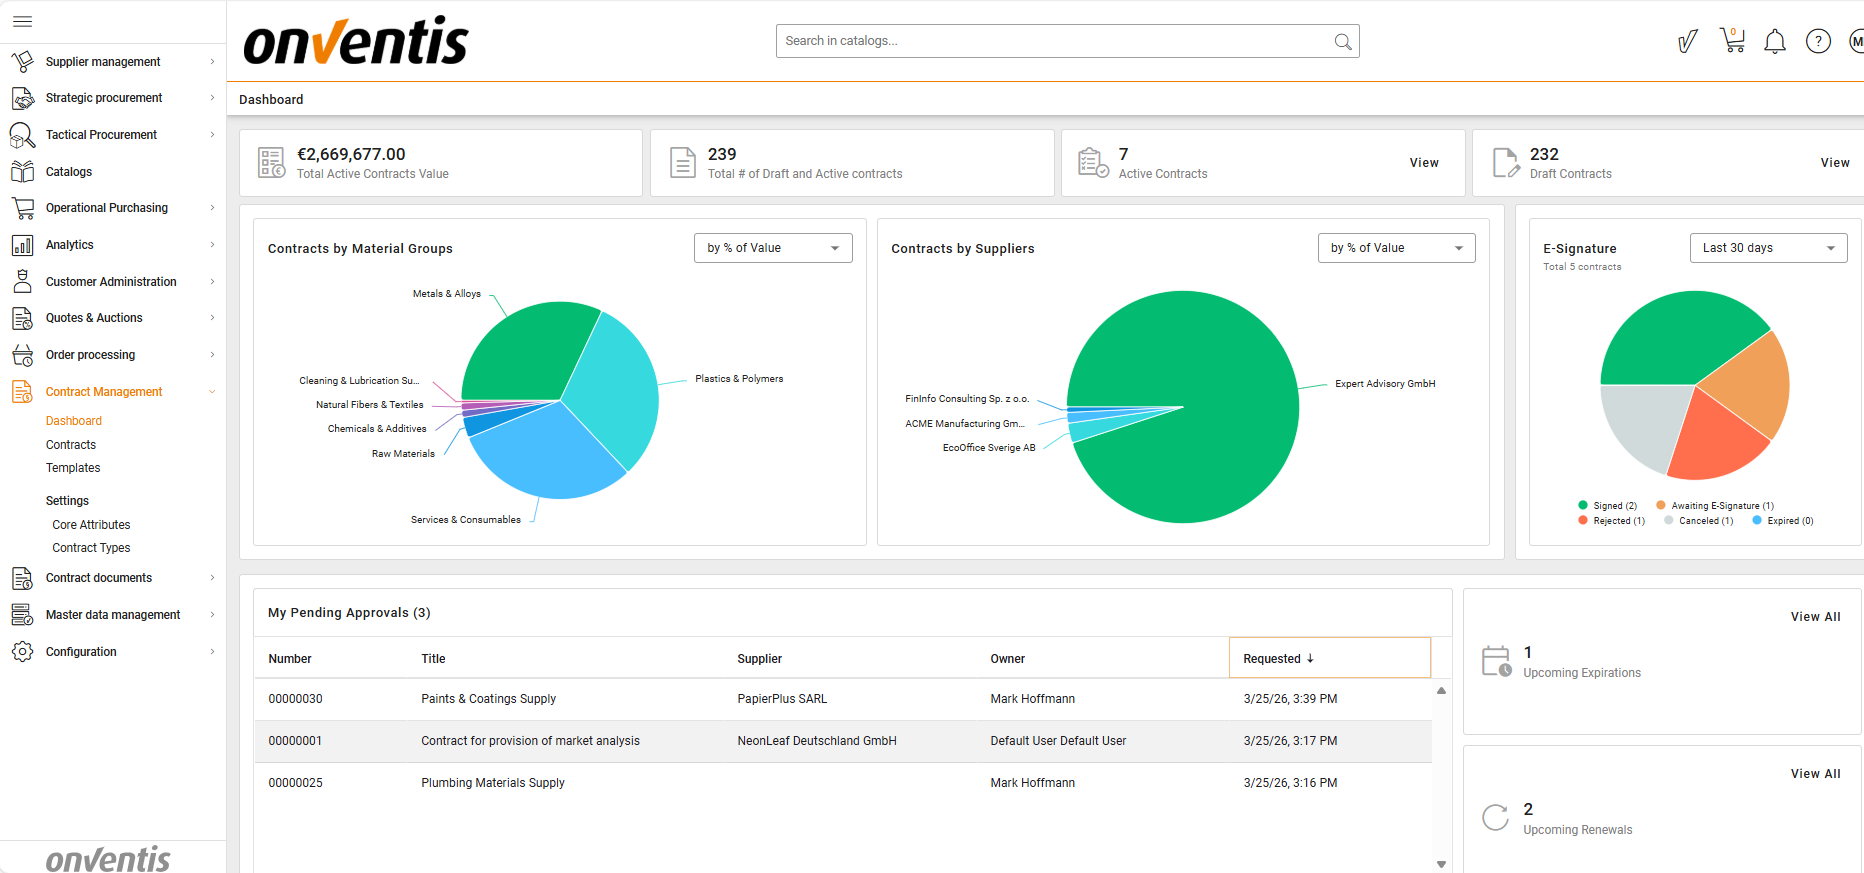
CLM Dashboard
The Contract Management Dashboard gives you a real-time overview of your organization’s contracts.
It helps you monitor contract volume, value, supplier distribution, and pending approvals — all in one place.
🗺️ Overview
The dashboard supports proactive contract management by visualizing performance metrics and upcoming milestones such as expirations and renewals.
🧑🦱 Who Can Use This
All users with access to the Contract Management module can view the dashboard.
💡 Note: Data visibility depends on your user role and assigned permissions.
💻 Main Dashboard Sections
1. Summary Metrics
At the top of the dashboard, you’ll see key indicators such as:
💰 Total Contract Value – The combined value of all Active contracts.
📄 Total # of Contracts – The total number of Active and Draft contracts in the system.
✅ Active Contracts – Contracts currently valid and in effect.
✏️ Draft Contracts – Contracts still under creation or review.
2. Contracts by Material group
A pie chart displays how contracts are distributed by material group.
Use this view to understand your organization’s spend allocation across different material groups.
You can switch the chart to show:
By % of Value – Based on total contract value per material group.
By Count – Based on the number of contracts per material group.
You can drill down by clicking on any material group segment to view the list of contracts within that material group. From there, you can navigate directly to a specific Contract Overview page if needed.
🧩 Note: If a contract is assigned to more than one material group, it is included in the calculation and displayed in each corresponding material group segment of the dashboard.
Contracts with values defined in currencies other than EUR are included in dashboard calculations by number of contracts, but their monetary value is counted as 0 EUR in the value-based pie charts.
3. Contracts by Supplier
This chart visualizes your top suppliers by contract value or count.
It helps identify supplier dependency, diversification, and contract distribution.
Use the dropdown to toggle between:
% of Value
Number of Contracts
You can drill down by clicking on any supplier segment to view the list of contracts associated with that supplier. From there, you can navigate directly to the relevant Contract Overview page if needed.
🧩 Note: Contracts with values defined in currencies other than EUR are included in dashboard calculations by number of contracts, but their monetary value is counted as 0 EUR in the value-based pie charts.
4. Upcoming Expirations and Renewals
📅 Upcoming Expirations – Number of contracts approaching their end date.
🔁 Upcoming Renewals – Number of contracts due for renewal.
Click View All to see the full list of contracts expiring or renewing soon.
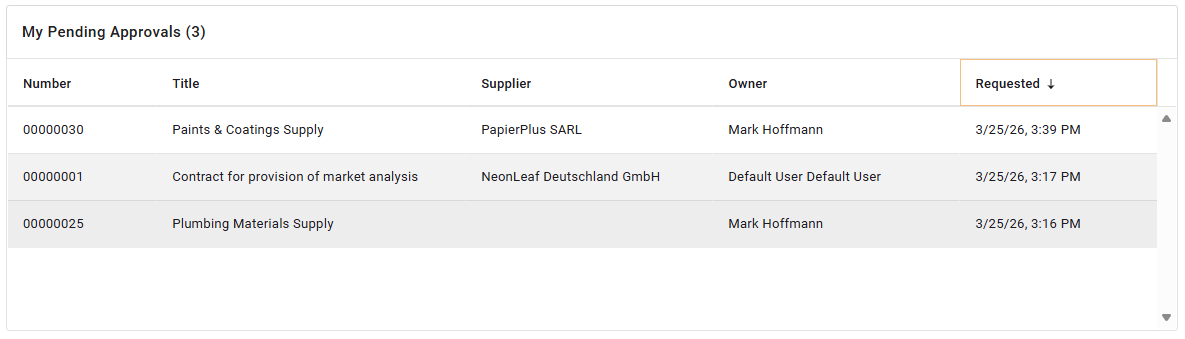
5. My Upcoming Approvals
Highlights contracts that currently require your approval to move forward in the contract lifecycle.
This widget helps users quickly identify contracts awaiting their decision, ensuring approvals are not missed and contract workflows are not delayed.
For each contract, the widget reflects:
Contract number and title
Supplier
Owner
When requested
Clicking any contract line opens the Contract Overview page directly, where the approval can be reviewed and completed.
🧩 Note: The widget does not display:
Contracts where the user is not assigned as an approver
Contracts that are not in the Negotiation Approval or Signing Approval status
Contracts that have already been approved or rejected by the user
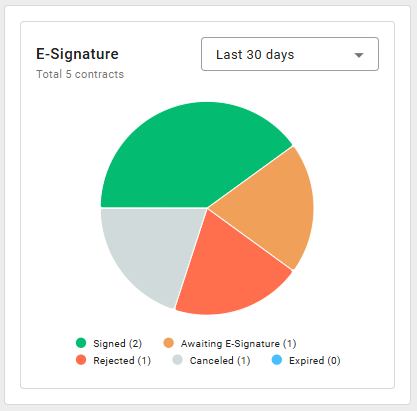
6. E‑Signing Status
Provides an overview of contracts that are currently in, or have recently completed, an e‑signing process.
🧩 Note: The chart is visible to users who have CLM Premium Power user licence. The chart only reflects contracts the user is permitted to see.
What the chart shows:
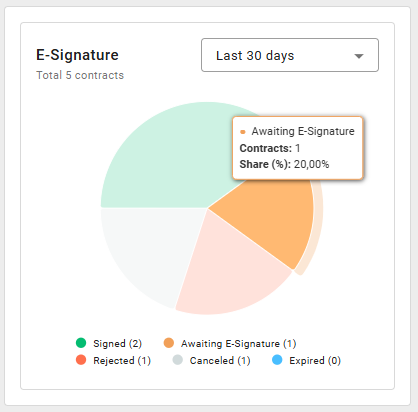
The pie chart shows the distribution of contracts by their latest e‑signing status, regardless of the current contract lifecycle status.
If a contract has been sent for e‑signature multiple times, only the most recent e‑signing phase is considered.
The total number of contracts is calculated based on contracts within the user’s organization that have a latest signing execution.
The chart includes the following e‑signing statuses:
🟠 Awaiting Signature – contracts currently waiting for one or more signatures; these are always shown and are not affected by the selected time range
🟢Signed – contracts successfully signed during their last e‑signing phase
🔴Rejected – contracts rejected by a signatory
⚪Cancelled – contracts where the last e‑signing phase was manually cancelled
🔵Expired – contracts where the last e‑signing phase expired
Users can switch between different time ranges to analyze completed e‑signing activity:
Last 30 days
Last 60 days
Last 90 days
🧩 Note: The time range applies to contracts whose last e‑signing phase ended within the selected period.
Contracts Awaiting Signature are shown regardless of the selected range.
Clicking a status slice (for example, Signed) opens a new tab with the Dashboard showing:
A Contracts grid listing all contracts whose last e‑signing phase ended with the selected status
Best Practices
💡 Tips for Effective Use:
Review your dashboard at least once a week to track pending approvals and expiring contracts.
Use the “E‑Signing Status” chart to monitor contracts awaiting signatures and follow up proactively with internal or external signatories.
Use “Contracts by Supplier” to identify suppliers with high contract value concentration.
Address contracts nearing expiration before they auto-renew or lapse.